


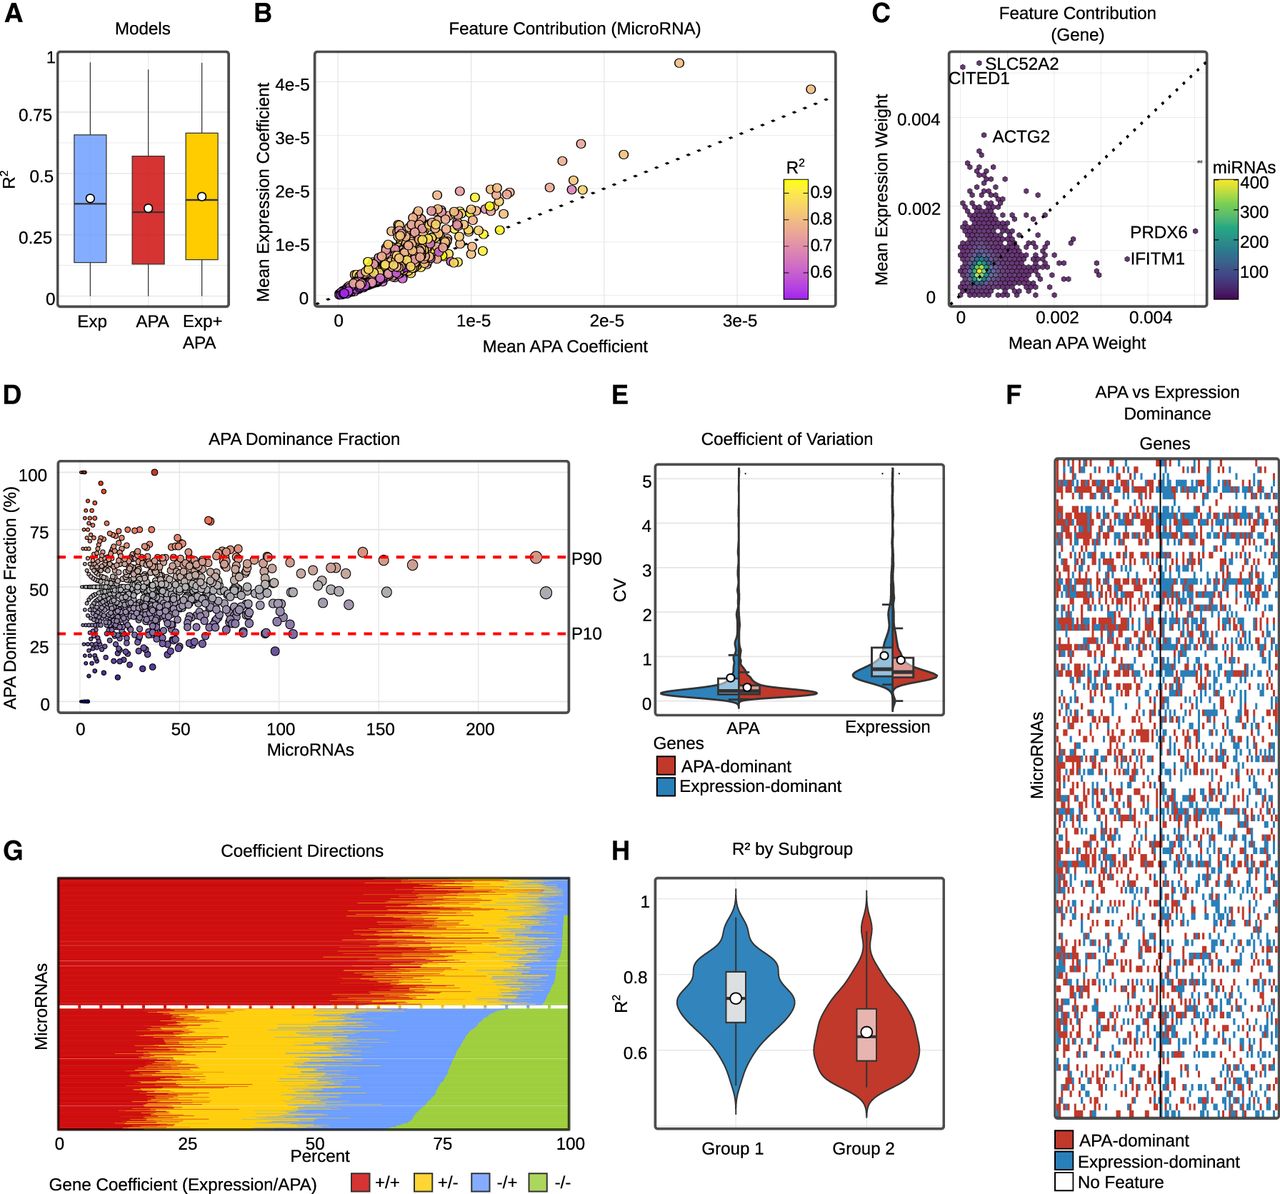
Contribution of APA and expression features to miRNA logFC prediction. (A) Comparison of predictive performance for models trained with APA-only, expression-only, or combined features. Boxplots show the distribution of R2 scores across miRNAs. (B) Scatter plot of average normalized absolute coefficients for APA versus expression features across miRNAs with R2 > 0.3. Each point represents one miRNA, colored by predictive performance (R2). (C) Hexbin plot of gene-level contributions, showing mean percentage weight of APA versus expression features across highly predictable miRNAs (R2 ≥ 0.5). Color scale denotes the number of miRNAs in which a given gene contributes. (D) Scatter plot of APA dominance fraction versus gene prevalence across all genes contributing to miRNAs with R2 ≥ 0.5. Each point represents one gene, with dashed lines marking the 10th and 90th percentile cutoffs used to define expression-dominant versus APA-dominant gene sets. (E) Coefficient of variation for APA versus expression features within the extreme APA-dominated and expression-dominated gene deciles. These measurements represent the raw variability from which APA and expression features are derived for model training. Stars denote outliers above the plotted range. (F) Heat map of categorical dominance (APA vs. expression) across all miRNAs with R2 ≥ 0.5 and the 100 most prevalent genes. Rows are ordered by decreasing miRNA R2 and columns by decreasing gene prevalence. White indicates that the gene was not a selected feature for that miRNA, blue indicates higher absolute expression coefficient, and red indicates higher absolute APA coefficient. (G) Stacked barplots of sign concordance between APA and expression coefficients across all genes for miRNAs with R2 ≥ 0.5. Colors denote the four possible sign combinations: both positive (++), APA positive with expression negative (+−), APA negative with expression positive (−+), and both negative (−−). miRNAs are stratified into two groups based on their composition, using a threshold of 10% (−−). (H) Comparison of R2 values between the two stratified groups.




