


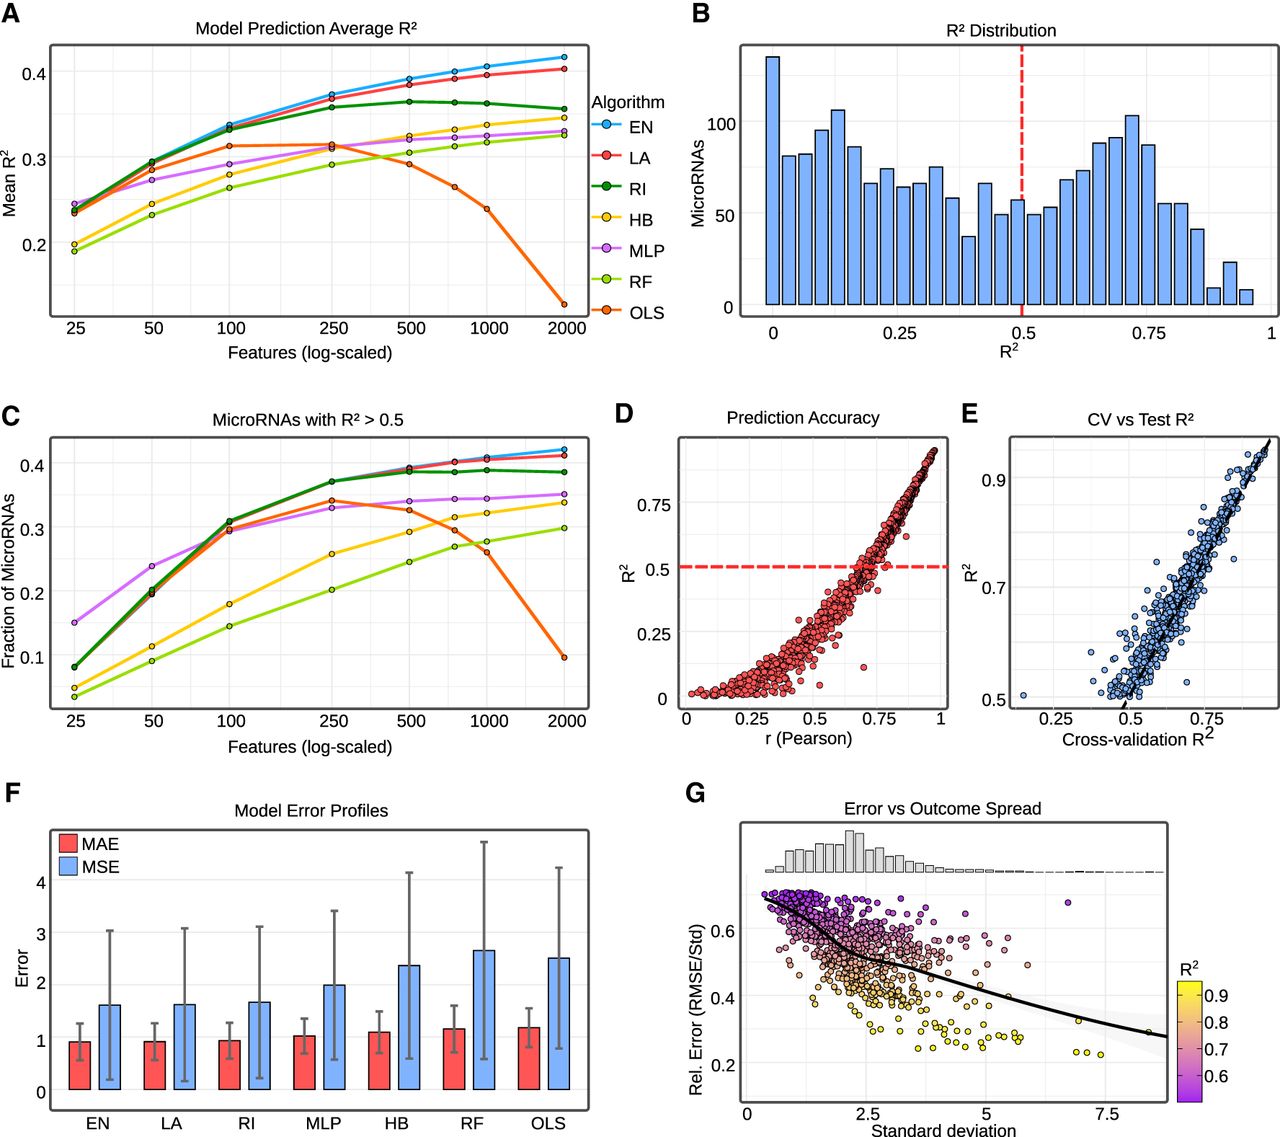
Prediction performance of ML models for miRNA logFC. (A) Line plot of mean R2 values across different ML algorithms as a function of the number of input features (tick marks represent logarithmically spaced values). Algorithms are abbreviated as follows: (EN) elastic net, (LA) lasso, (RI) ridge regression, (HB) HistGradientBoost, (MLP) multilayer perceptron, (RF) random forest, (OLS) ordinary least squares. (B) Distribution of R2 values from EN trained with 1000 features across all evaluated miRNAs. (C) Fraction of miRNAs achieving R2 > 0.5 as a function of the number of input features (tick marks represent logarithmically spaced values). (D) Dot plot of Pearson correlation between predicted and observed logFC values versus miRNA-specific R2. (E) Comparison of cross-validation R2 against test set R2 across miRNAs. (F) Mean absolute error (MAE) and mean squared error (MSE) across algorithms (for 1000 features). (G) Relationship between the standard deviation of predicted logFC values and relative error (RMSE/standard deviation). The distribution of standard deviation values is shown as a histogram.




