


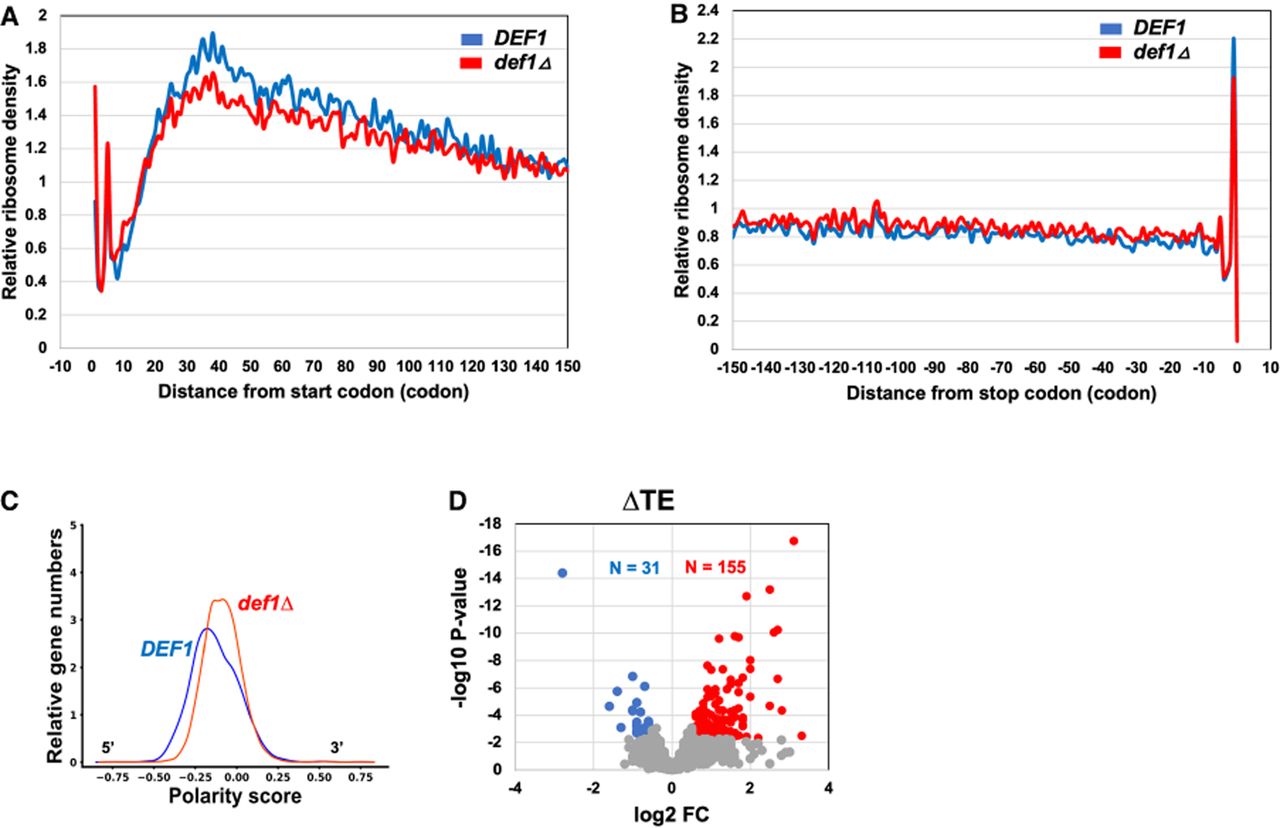
Ribosome profiling (Ribo-seq) of the def1Δ mutant revealed altered ribosome distribution and increased nonoptimal codons in the A-site. (A) Metaplot analysis of ribosome density distribution over the first 150 codons of all 5140 transcripts. Metagene plots were generated using RiboMiner v0.2, and the ribosome density at each position is normalized by the overall ribosome density within the coding sequence. Wild-type (in blue) and def1Δ (in red) conditions are plotted. (B) Metaplot analysis as in A. The ribosome density distribution across 150 codons upstream of the stop codon of all ORFs. (C) Polarity score of ribosome density across mRNAs. Transcriptome-wide shift in overall ribosome distribution was evaluated and represented for both wild-type (in blue) and def1Δ mutant (in red). (D) Change in translation efficiency (TE) in a def1Δ mutant.




