


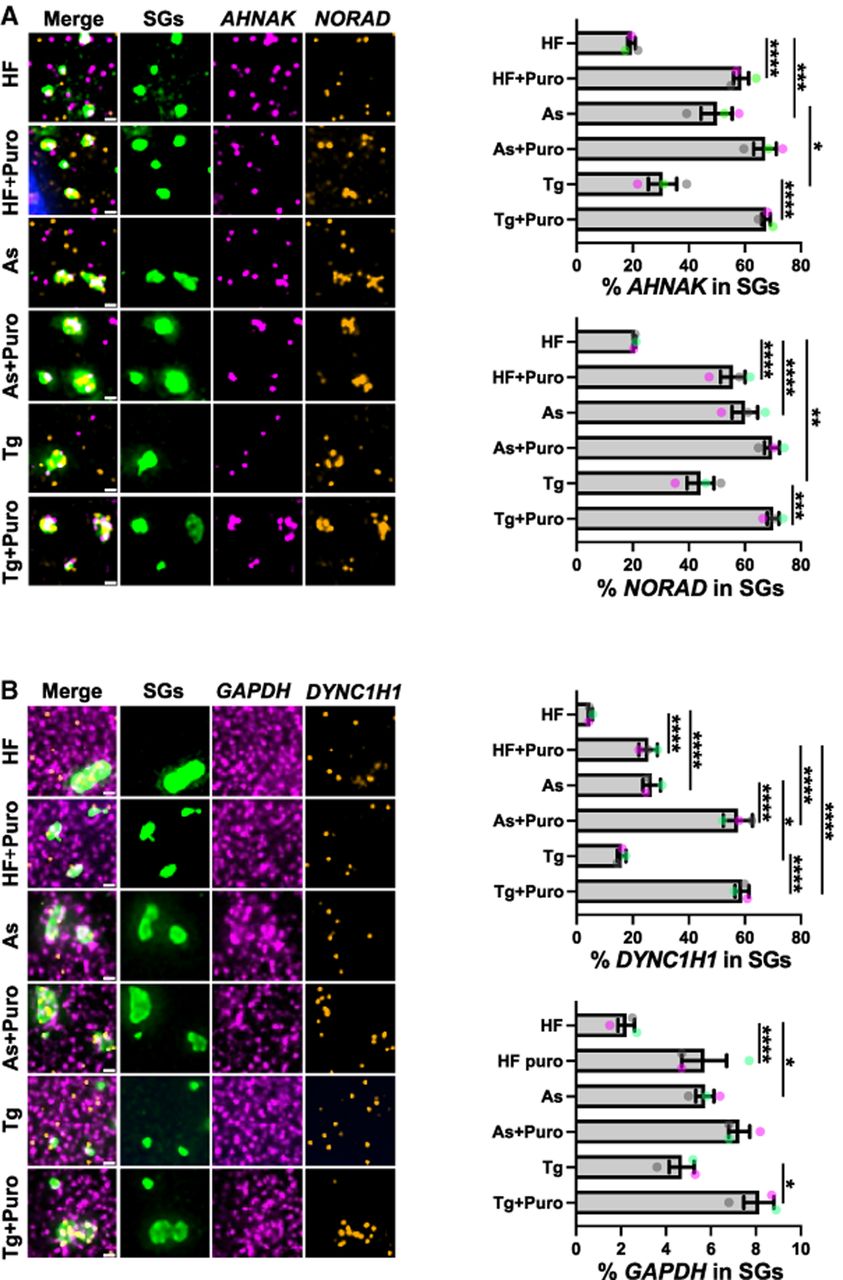
Comparative analysis of RNA localization to stress granules during halofuginone, arsenite, or thapsigargin stresses in the presence or absence of puromycin using a candidate approach. U-2 OS cells expressing GFP-G3BP1 (green) were treated with arsenite (25 μM, “As,” 1 h) or thapsigargin (0.04 μM, “Tg,” 1 h) in the presence or absence of puromycin (10 μg/mL), or halofuginone (2 μM, “HF,” 4 h) with or without puromycin (10 μg/mL) for the last 30 min and smFISH performed. (A) AHNAK (magenta) and NORAD (gold) were probed in the same cells. (B) GAPDH (magenta) and DYNC1H1 (gold) were probed in the same cells. For each panel, representative images are shown at left; at right: quantification of the average ± SEM percent RNA localization in stress granules from n = 3 independent experiments (15 cells per replicate) with the average from each replicate shown as green, gray, and pink points. Scale bars, 1 µm. One-way ANOVA with Tukey HSD tests were done to assess significance with (*) P < 0.05, (**) P < 0.01; (***) P < 0.005, (****) P < 0.001.




