


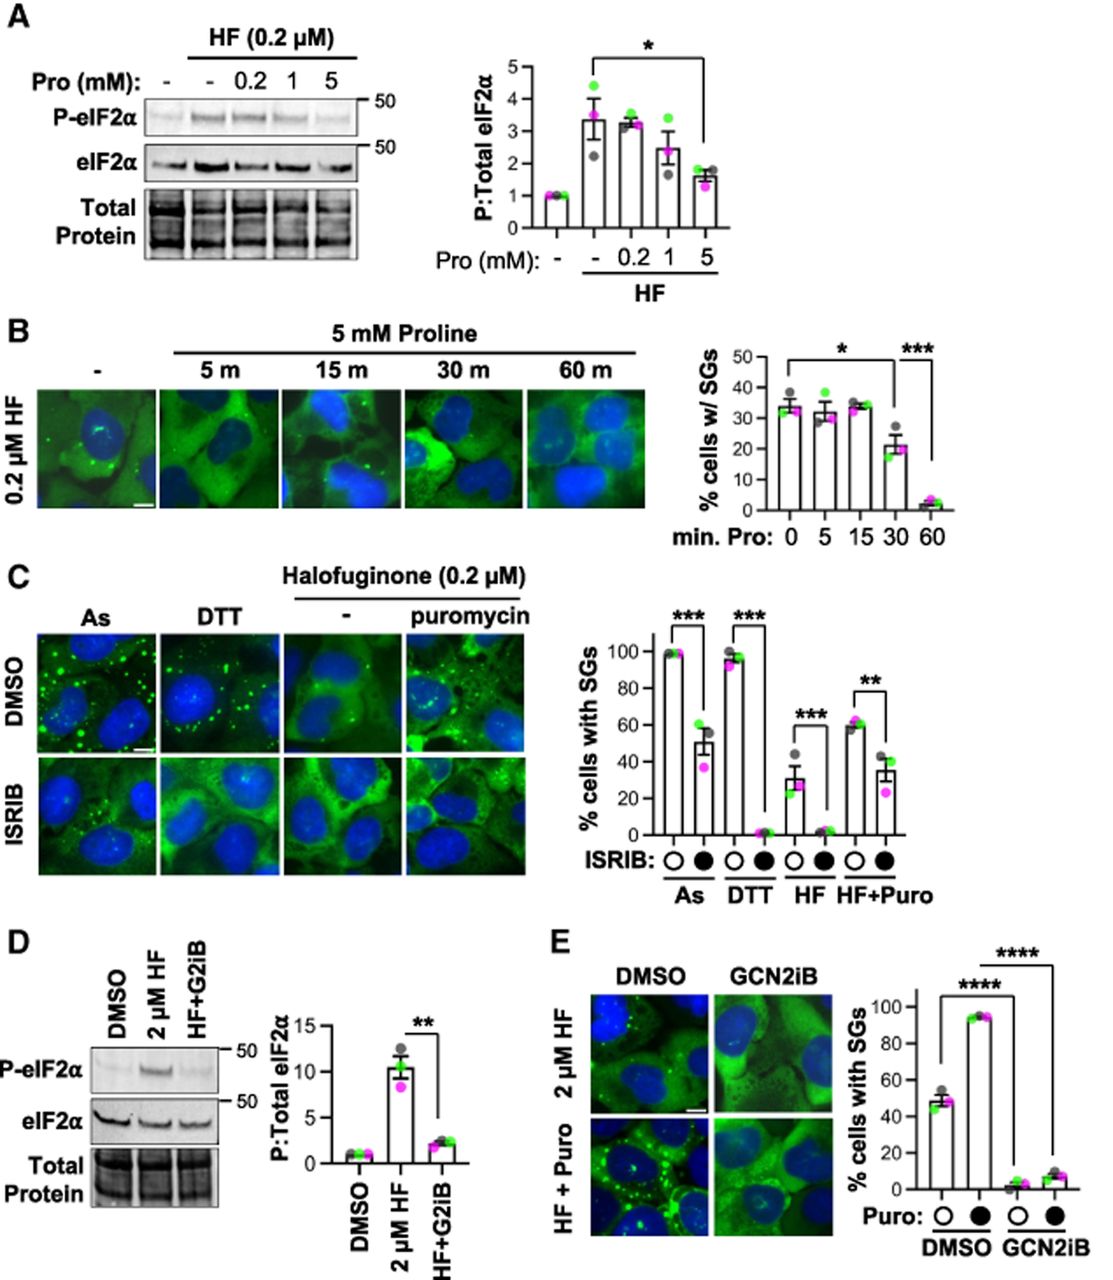
Stress granule assembly during halofuginone treatment requires the GCN2-mediated ISR. (A) P-eIF2α and total eIF2α western blot of cells treated with halofuginone (0.2 µM, “HF”) and proline (0–5 mM) for 4 h. (B) U-2 OS cells expressing GFP-G3BP1 (green) were treated with halofuginone (0.2 µM, 4 h) with proline (5 mM) added for 5–60 min; cells were fixed and nuclei stained with Hoechst (blue). (C) Stress granules (GFP-G3BP1) detected in cells treated with DMSO carrier or ISRIB (1 µM) for 4 h, stressed with arsenite (0.25 mM) or DTT (2 mM) added for the last 30 min, or cotreated with halofuginone (0.2 µM) for 4 h, with or without puromycin (10 µg/mL) added for the last 30 min. (D) Western blot of P-eIF2α and total eIF2α from cells treated with DMSO control, or halofuginone (2 µM) for 4 h with DMSO carrier or GCN2iB (5 µM, “HF + G2iB”). (E) Stress granules (GFP-G3BP1) in cells treated as in D, with or without puromycin (10 µg/mL) added for the last 30 min. Representative images (at left) shown from n = 3 independent replicates, and quantifications reported as average ± SEM with green, gray, and pink points representing the values from each replicate (at right). Significance assessed with ordinary one-way ANOVA followed by Tukey's multiple comparisons tests with (*) P < 0.05, (**) P < 0.01, (***) P < 0.005, (****) P < 0.001. Scale bars, 10 µm. Molecular weights (kDa) are shown for each western blot.




