


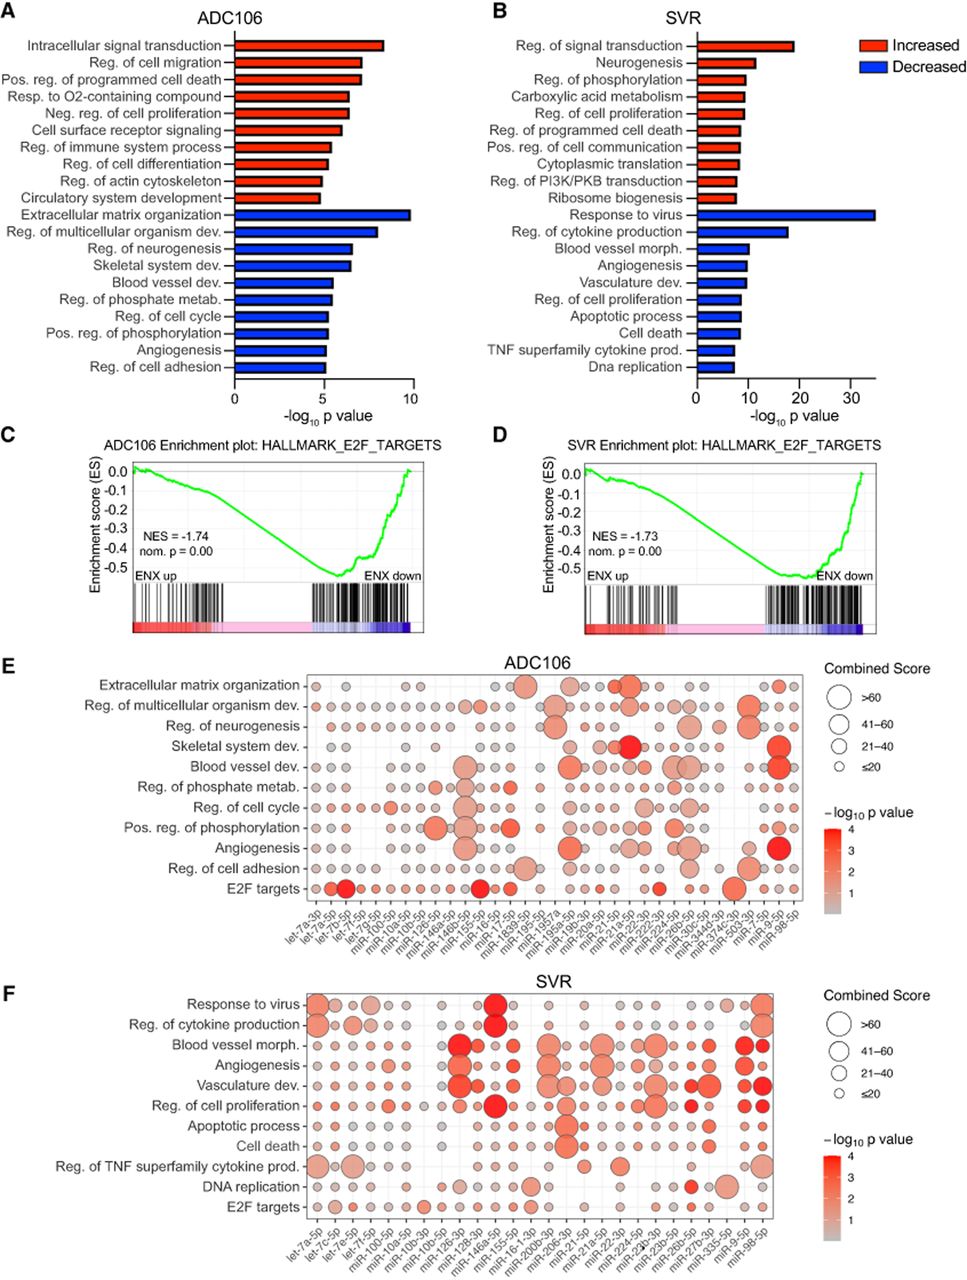
FIGURE 5.
Enoxacin alters mRNA expression. (A,B) DAVID gene ontology analyses of significantly upregulated (red) and downregulated (blue) genes in ADC106 (A) or SVR (B) cells. (C,D) GSEA of the hallmark pathway “E2F targets” in the ADC106 (C) and SVR (D) cells. Normalized enrichment scores (NESs) and nominal P-values are shown. (E,F) Enrichment plot of potential miRNA-regulated genes, with the downregulated genes (FDR < 0.05, log2 fold change <−0.5) within the top oncogenic pathways based on DAVID gene ontology or the overlapping hallmark GSEA terms in ADC106 (E) or SVR cells (F) treated with 100 µM ENX or DMSO.




