


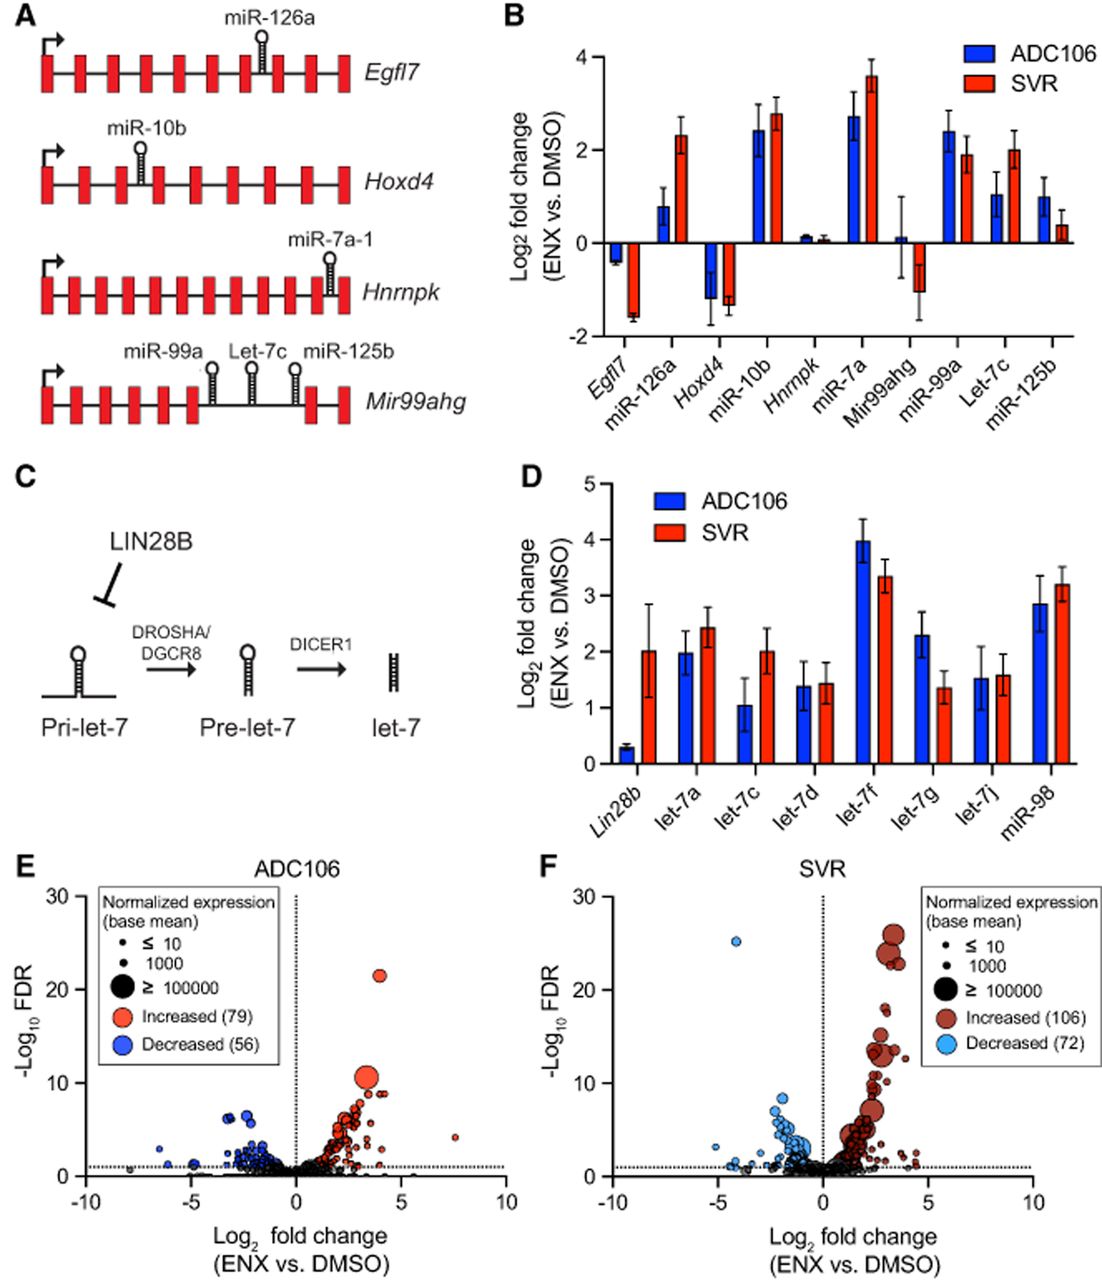
Enoxacin enhances miRNA biogenesis. (A) Graphic of intronic miRNAs and their host genes. (B) Log2 fold change in expression comparing enoxacin (ENX) versus DMSO treated ADC106 (blue) or SVR (red) of intronic miRNAs and host gene transcripts by RNA-seq. (C) Graphic of LIN28B regulation of let-7 miRNAs. (D) Log2 fold change in expression of Lin28b and let-7 family miRNAs by RNA-seq. (E) Volcano plot of the −log10 FDR versus the log2 fold change in miRNA abundance with point size representing mean normalized expression (base mean) of ADC106 cells or (F) SVR cells treated with DMSO or 100 µM ENX for 72 h. Differentially expressed miRNAs with increased or decreased abundance with FDR < 0.05 and log2 fold change >1 and <−1 as indicated.




