


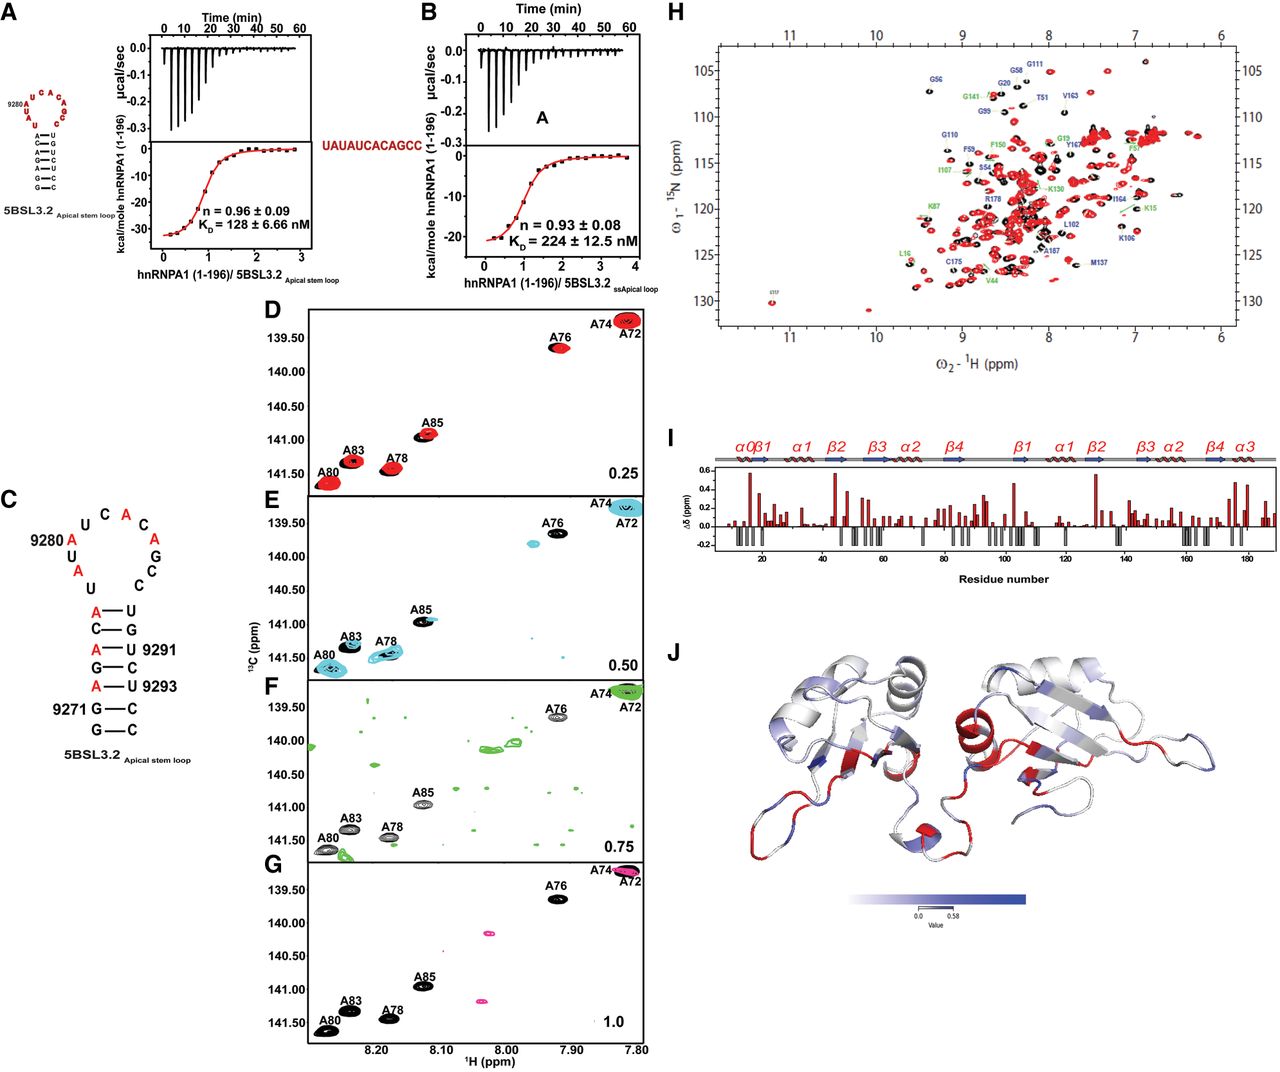
Interaction of hnRNPA1 with the apical stem–loop of the 5BSL3.2 element from the HCV CRE domain. (A,B) ITC profiles showing the binding of hnRNPA1 (1–196) to (A) the wild-type 5BSL3.2 apical stem–loop and (B) a mutant 5BSL3.2 loop containing the UAUUACACACAC sequence. The top panels show the raw heat changes upon injection of RNA into the protein solution, and the bottom panels show the integrated binding isotherms fitted to a one-site binding model. The derived thermodynamic parameters (n and KD) are indicated. (C) Predicted secondary structure of the 5BSL3.2 apical stem–loop used for NMR analysis. (D–G) Overlay of 2D 1H–13C HSQC spectra of selectively labeled adenosine residues in the apical stem–loop RNA titrated with increasing molar ratios (0.25 [red], 0.5 [cyan], 0.75 [green], and 1.0 [magenta]) of hnRNPA1 (1–196). Chemical shift perturbations upon protein binding are indicated. (H) Superposition of 2D 1H–15N HSQC spectra of hnRNPA1 (1–196) in the free state (black) and in complex with 5BSL3.2 RNA (red). Assigned backbone amide resonances are labeled. (I) Histogram of combined 1H–15N chemical shift perturbations (Δδ) plotted as a function of hnRNPA1 residue number upon RNA binding. The secondary structure elements of hnRNPA1 are indicated above the plot. (J) Mapping of chemical shift perturbations onto the 3D structure of hnRNPA1. The color gradient reflects the magnitude of the combined chemical shift changes (Δδ) according to the scale bar shown (white to blue). Residues showing amide signal broadening due to exchange upon RNA binding are shown in red.




