


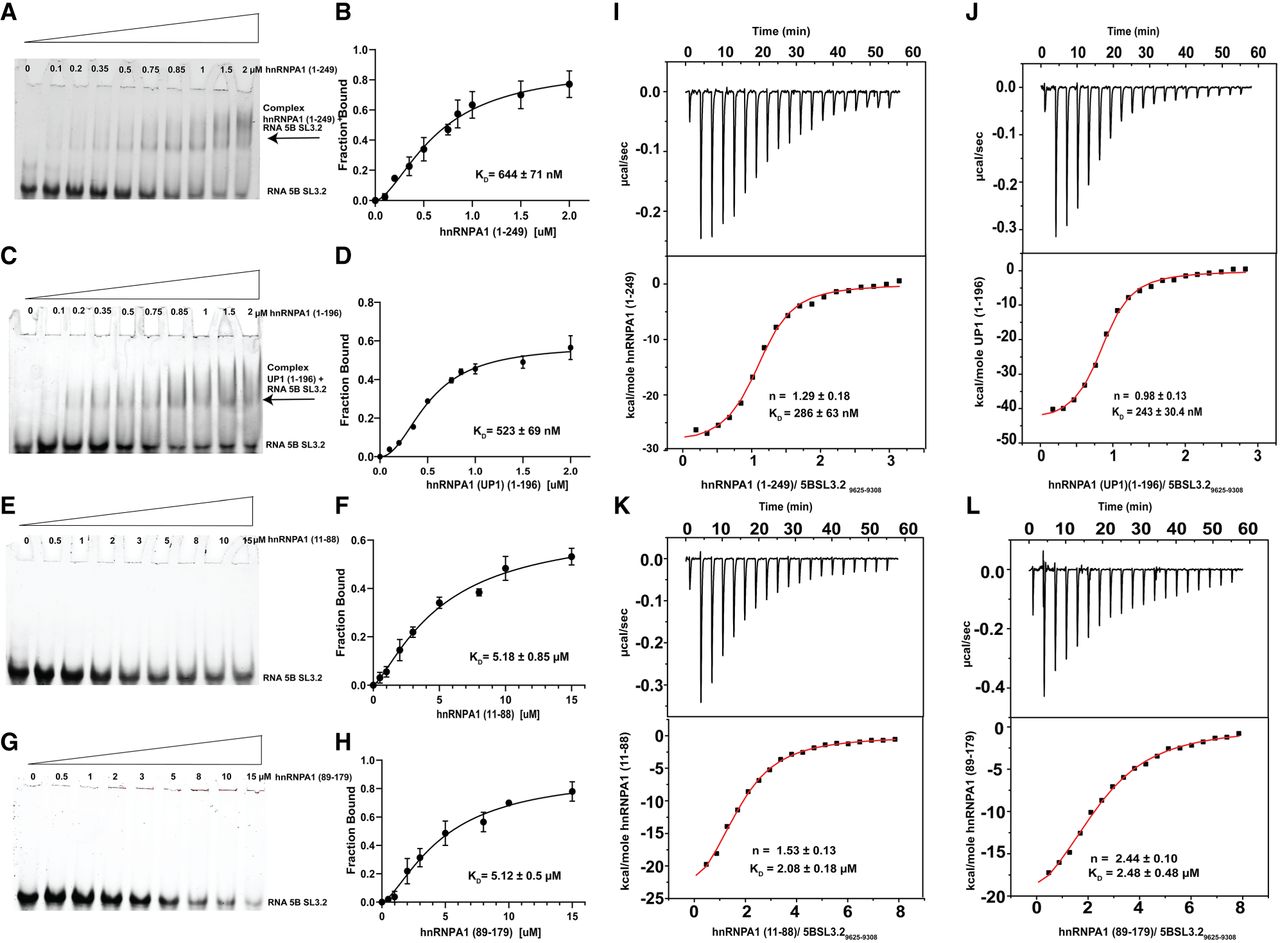
Binding analysis of hnRNPA1 constructs to the HCV 5BSL3.2 RNA element. (A,C,E,G) Electrophoretic mobility shift assays (EMSAs) showing complex formation between 5BSL3.2 RNA and increasing concentrations of (A) hnRNPA1 (1–249), (C) UP1 fragment (1–196), (E) RRM1 domain (1–88), and (G) RRM2 domain (89–179). The arrows indicate RNA–protein complexes. Protein concentrations (μM) are noted above each lane. (B,D,F,H) Quantification of EMSA data. The fraction of RNA bound was plotted as a function of protein concentration and fitted to a one-site binding model to determine apparent dissociation constants (KD). (I–L) Isothermal titration calorimetry (ITC) analysis of 5BSL3.2 RNA binding to (I) hnRNPA1 (1–249), (J) UP1 (1–196), (K) hnRNPA1 (1–88), and (L) hnRNPA1 (89–179). (Upper panels) Raw thermograms; (lower panels) integrated binding isotherms fitted to a single-site binding model. Derived KD values and binding stoichiometries (n) are indicated.




