


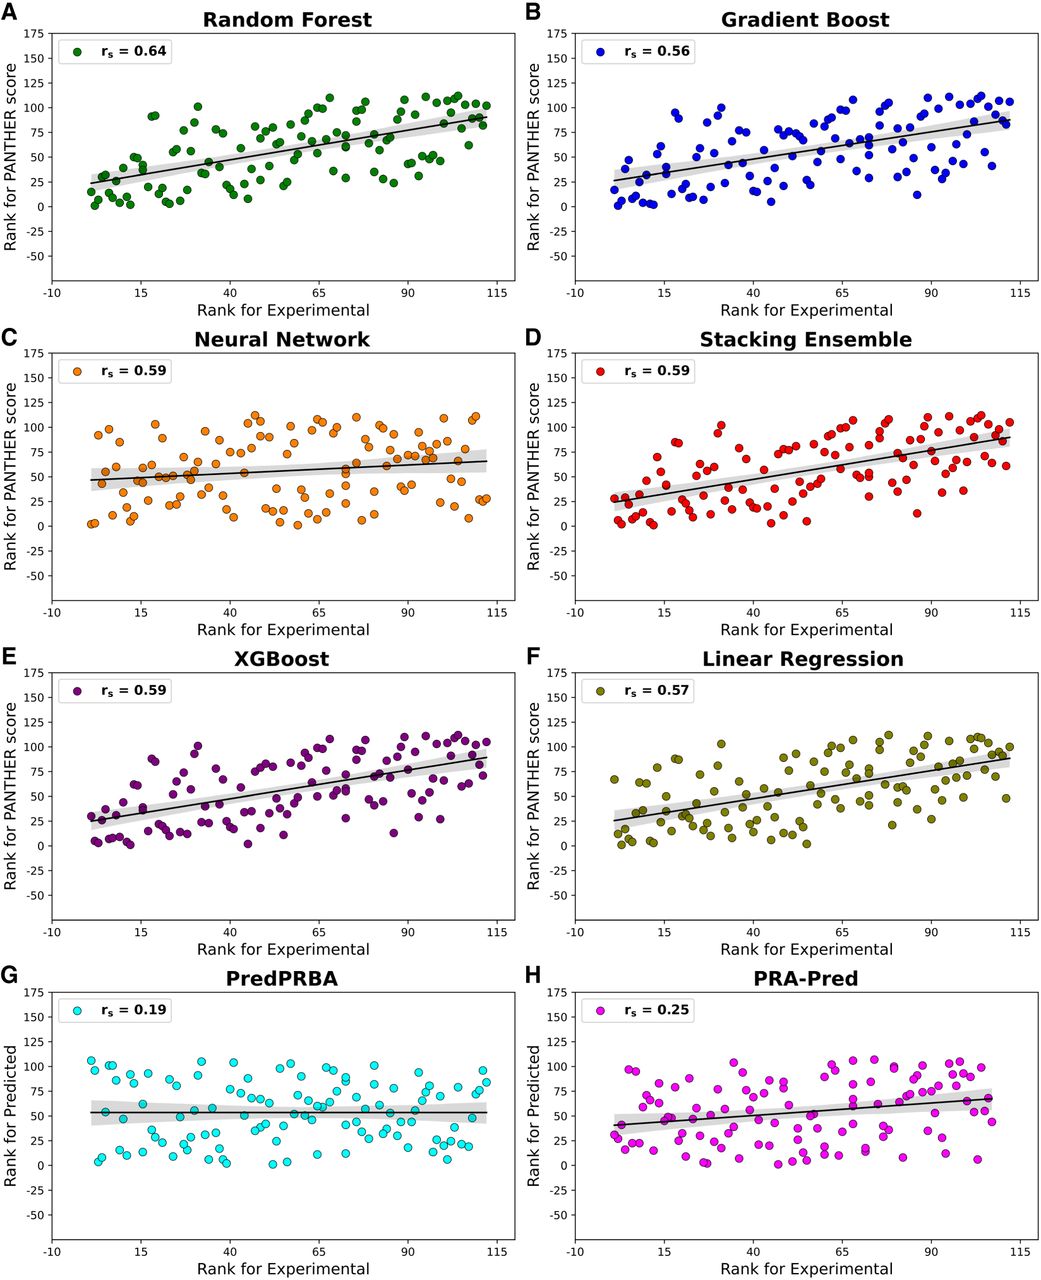
FIGURE 9.
Scatter plots showing the Spearman rank correlation (rs) between experimental ΔG ranks and ranks of PANTHER Score for the models. This figure also includes the corresponding plots for the other two tested methods (PredPRBA and PRA-Pred).




