


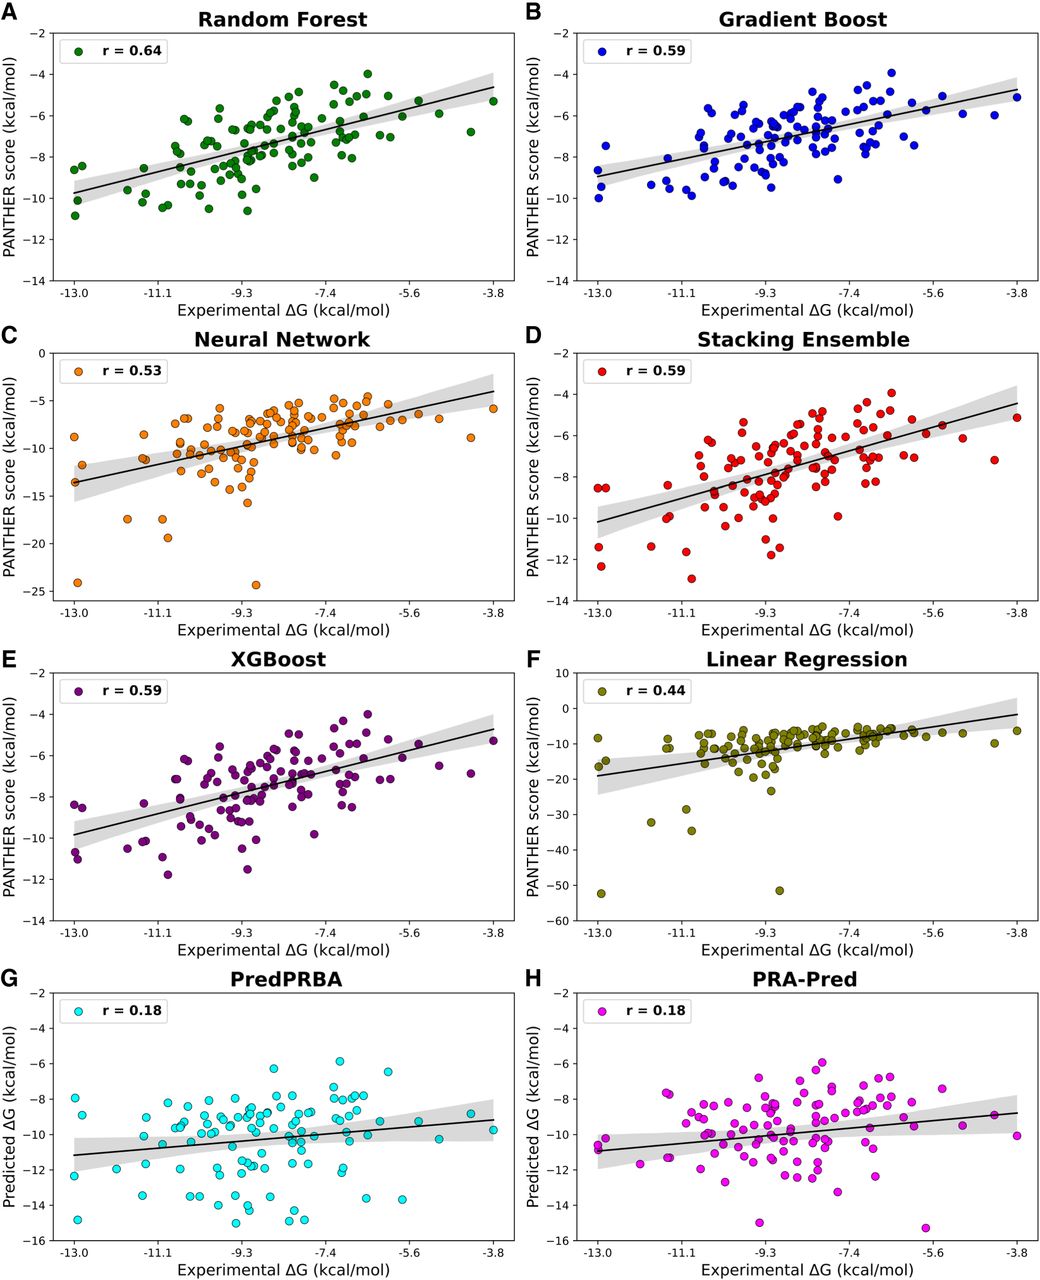
FIGURE 8.
Scatter plots showing the linear correlations (as expressed by [r]) between experimental ΔG values and computed PANTHER Scores for various models: Random Forest Regression, Gradient Boost, Neural Network, Stacking Ensemble, XGBoost Regression, and Linear Regression. This figure also includes the corresponding plots for the other two tested methods (PredPRBA and PRA-Pred).




