


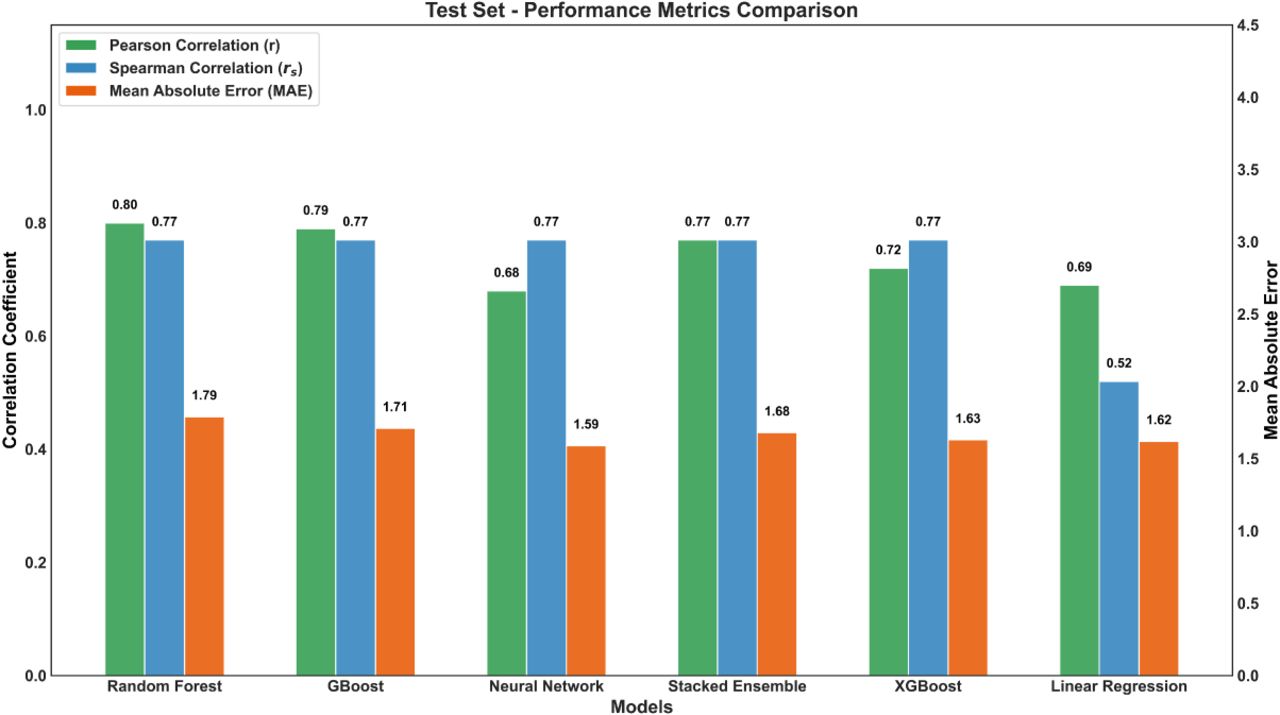
FIGURE 6.
Performance comparison of machine learning models based on Pearson correlation (r), Spearman correlation (rs), and mean absolute error (MAE) for the test set. Random Forest Regression demonstrates the highest predictive accuracy, while Linear Regression shows the lowest performance.




