


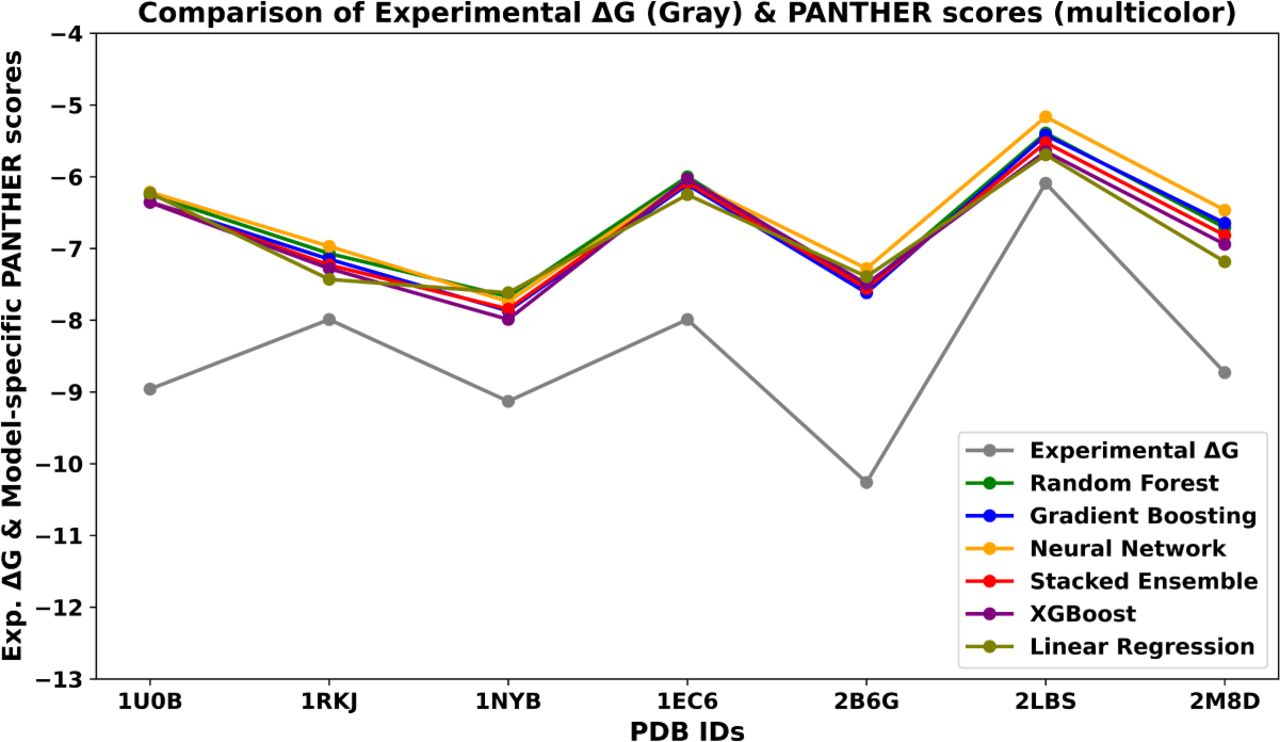
Comparison of experimental ΔG (kcal/mol) and model-specific PANTHER Scores predicted with various ML models for the test set. The x-axis represents the PDB IDs included in the test set, while the y-axis reports the corresponding experimental ΔG values (gray) and the model-specific PANTHER Scores predicted by various outputs (predicted local energies) of machine learning (ML) models conjugated with the here proposed local-to-global methodology. Model-specific PANTHER Scores obtained from Random Forest Regression, Gradient Boosting, Neural Network, Stacked Ensemble, XGBoost, and Linear Regression models are represented in green, blue, orange, red, magenta, and olive, respectively. This comparison was performed to evaluate the consistency and trends between experimental ΔG and PANTHER Scores predicted by various ML models. The results indicate no substantial deviation among the predictions of the different ML models, suggesting that no single model can be preferentially selected to define the final PANTHER Score. Therefore, all ML models were further evaluated using an unbiased external data set, referred to as the “Model evaluation,” as detailed in the Results and Discussion section.




