


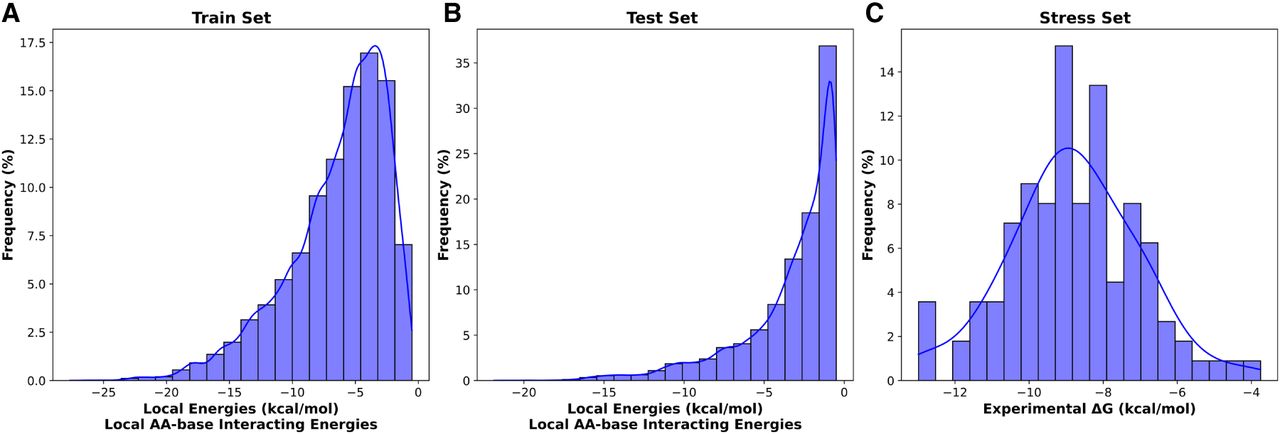
FIGURE 4.
Distribution of MD-derived local energies of the interacting amino acid–nucleotide bases for the (2A) training set and (2B) test set, alongside the experimental ΔG for the stress set (2C). The distributions illustrate consistency and variation across the monitored energy values, with a fitted line highlighting the trends.




