


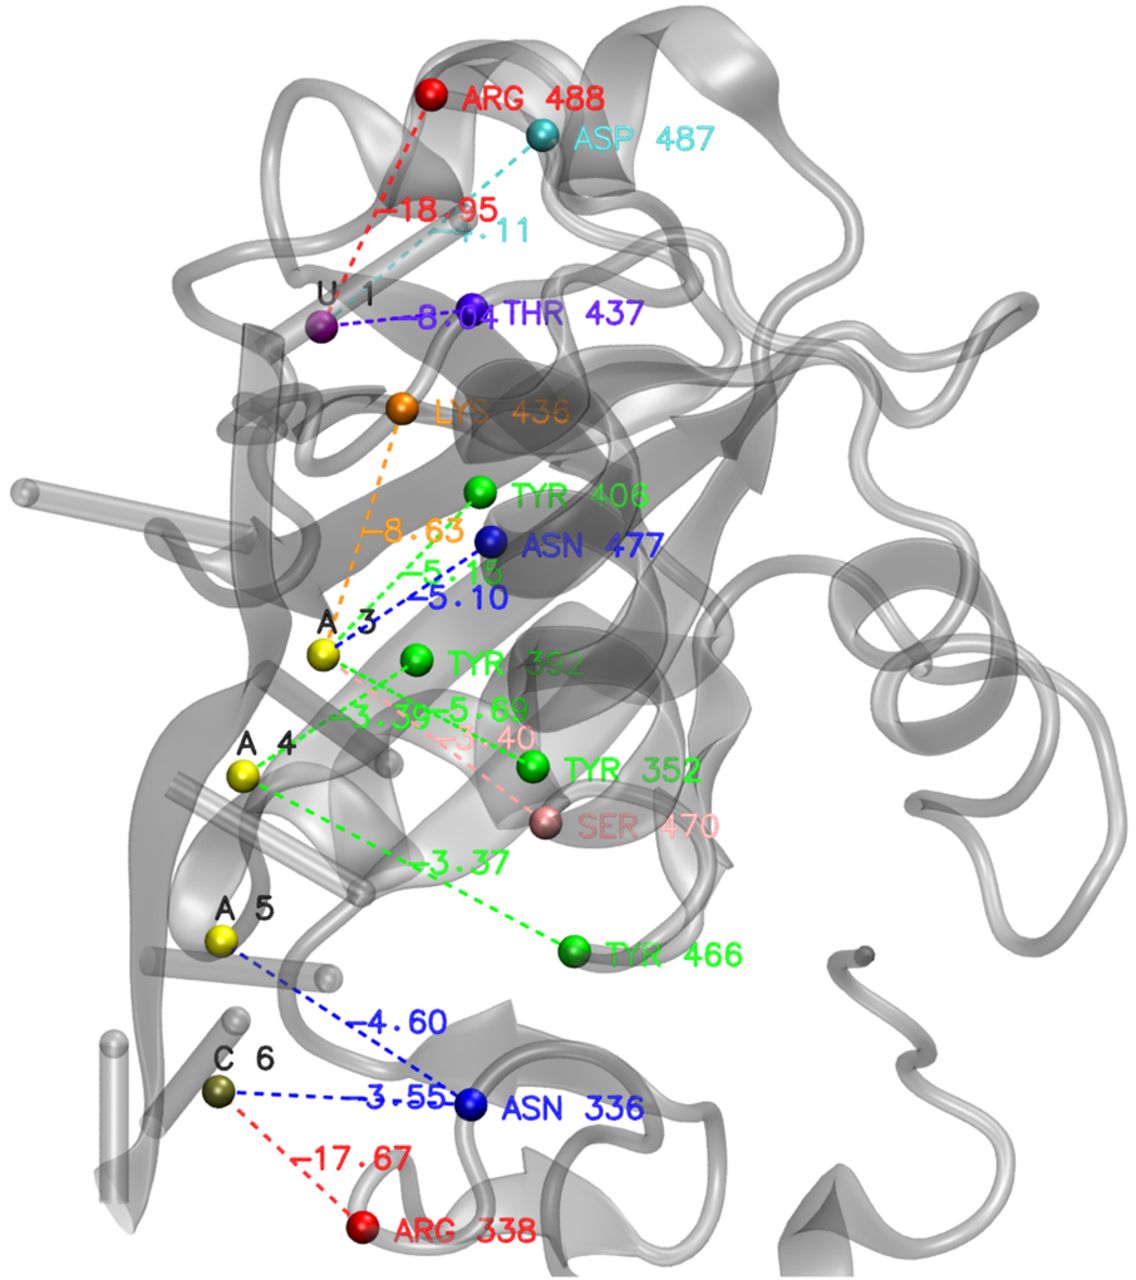
Visualization of protein–nucleotide interactions for the Mmi1 protein in complex with 7-mer RNA (PDB ID 6FPQ) showing residue pairs with their local binding energies (kcal/mol). Residue labels are positioned close to their corresponding spheres, with energy values displayed along dashed connection lines. These spheres are the center of mass of each interacting residue. By averaging these local energies obtained from Random Forest Regression models, we finally achieved the PANTHER Score of −7.05 kcal/mol, whereas the experimental value of 6FPQ is −6.93 kcal/mol. The interacting groups are colored according to their stabilizing energies by a color ramp ranging from red (strongly interacting groups) to blue (poorly interacting groups). The data are shown in Supplemental Table S6.




