


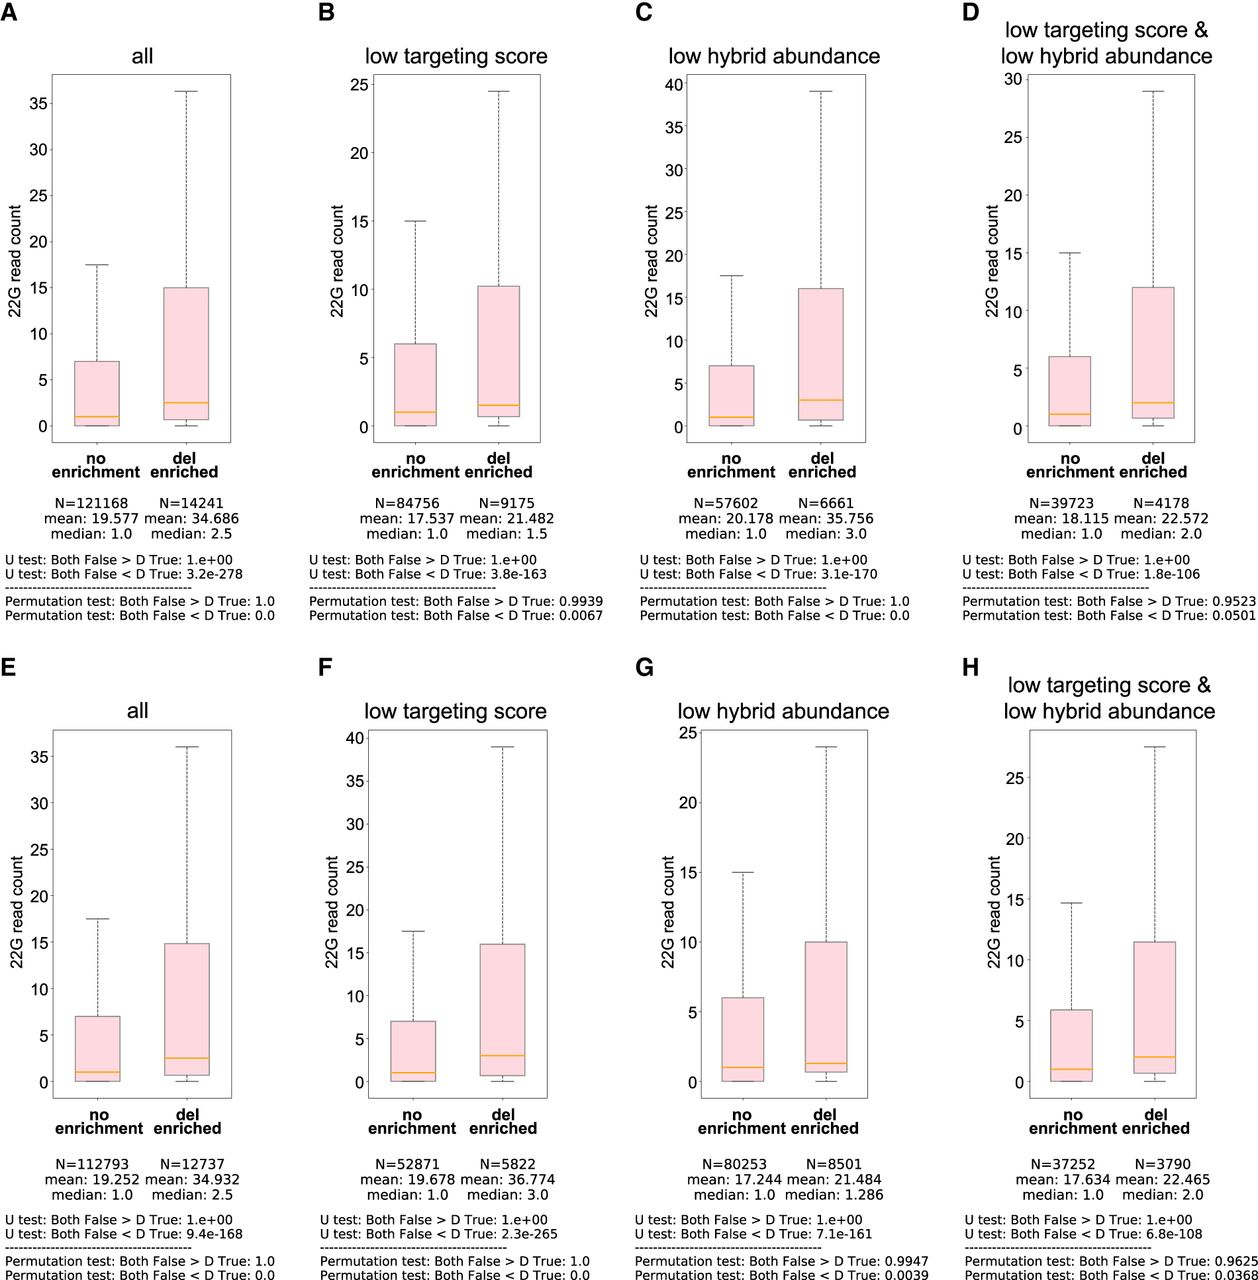
mRNA regions enriched for crosslinking-induced deletions in non-hybrid reads of CLASH data exhibited stronger regulatory effects than those without CIM enrichment. (A) Comparison of WAGO-1 22G-RNAs from target sites of the PRG-1 PIWI CLASH data between mRNA regions not enriched for deletion to those enriched for deletion. The statistical significance (P-value) of the difference in fold change was calculated by the Mann–Whitney U test and the permutation test. (B–D) Comparison of WAGO-1 22G-RNAs from target sites of the PRG-1 PIWI CLASH data with poor targeting scores (sites with pirScan < −15) (B), low abundant reads (C), or both (D) between mRNA regions not enriched for deletion to those enriched for deletion. The statistical significance (P-value) of the difference in fold change was calculated by the Mann–Whitney U test and the permutation test. (E) Comparison of target sites not carrying CIMs for the WAGO-1 22G-RNAs from the PRG-1 PIWI CLASH data between mRNA regions not enriched for deletion to those enriched for deletion. The statistical significance (P-value) of the difference in fold change was calculated by the Mann–Whitney U test and the permutation test. (F–H) Comparison of target sites not carrying CIMs of WAGO-1 22G-RNAs from the PRG-1 PIWI CLASH data with poor targeting scores (sites with pirScan < −15) (F), low abundant reads (G), or both (H) between mRNA regions not enriched for deletion to those enriched for deletion. The statistical significance (P-value) of the difference in fold change was calculated by the Mann–Whitney U test and the permutation test.




