


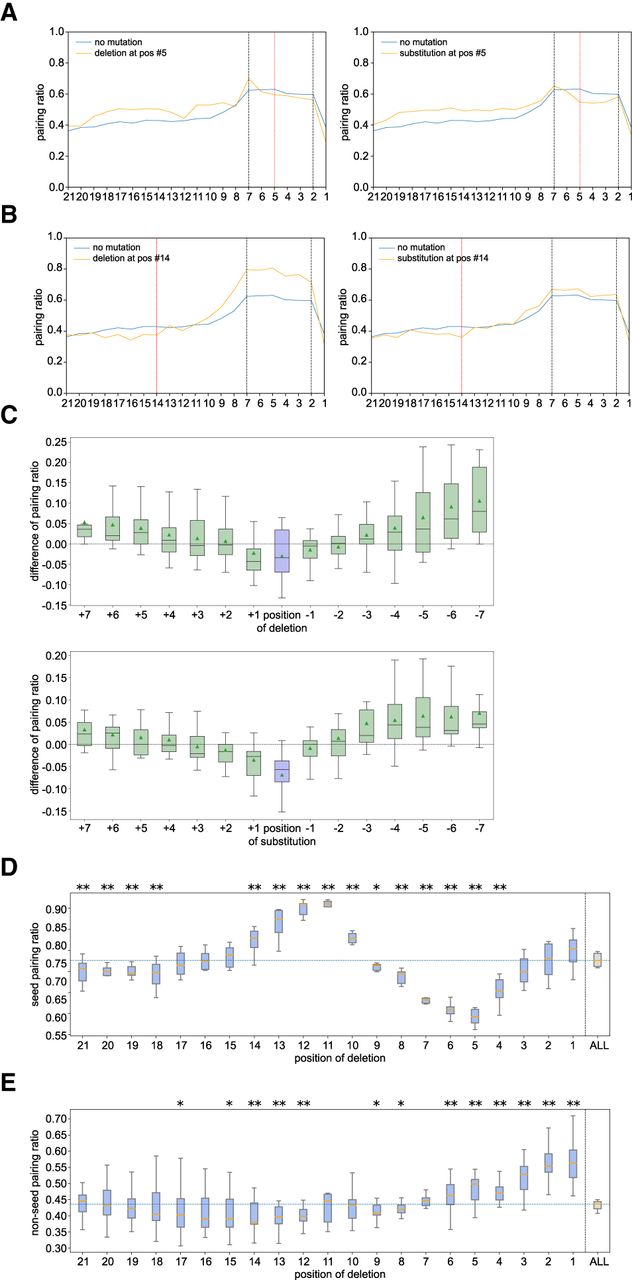
CIMs preferentially occur at positions with local piRNA pairing mismatches. (A) Pairing ratios between mRNA and piRNA at the indicated position (pos) from hybrids containing mRNA deletions (left) or substitutions (right) at position 5 (red line) compared to hybrids without mutations (orange lines) in PRG-1 PIWI CLASH data. (B) Pairing ratio of mRNA and piRNAs at the indicated position (pos) of piRNAs from hybrids containing mRNA deletion (left) or substitution (right) at position 14 (red line) compared to hybrids without mutations (orange lines) in PRG-1 PIWI CLASH data. (C) Differences in pairing ratios around CIMs in PRG-1 PIWI CLASH data. The differences were calculated by subtracting the pairing ratios of hybrids with deletions (top) or substitutions (bottom) from the pairing ratios of all hybrids. The analysis was centered on the CIM location (position 0) and extended to the indicated upstream and downstream nucleotides. Lines display median values, boxes display first and third quartiles, and whiskers display fifth and 95th percentiles, respectively. (D) Differences in pairing ratio at the seed region between hybrids with deletion at the indicated position and hybrids with CIMs in PRG-1 PIWI CLASH data. Lines display median values, boxes display first and third quartiles, and whiskers display fifth and 95th percentiles, respectively. (*) P < 0.05 and (**) P < 0.01. (E) Differences in pairing ratio at the non-seed region between hybrids with deletion at the indicated position and hybrids with CIMs in PRG-1 PIWI CLASH data. Lines display median values, boxes display first and third quartiles, and whiskers display fifth and 95th percentiles, respectively. (*) P < 0.05 and (**) P < 0.01.




