


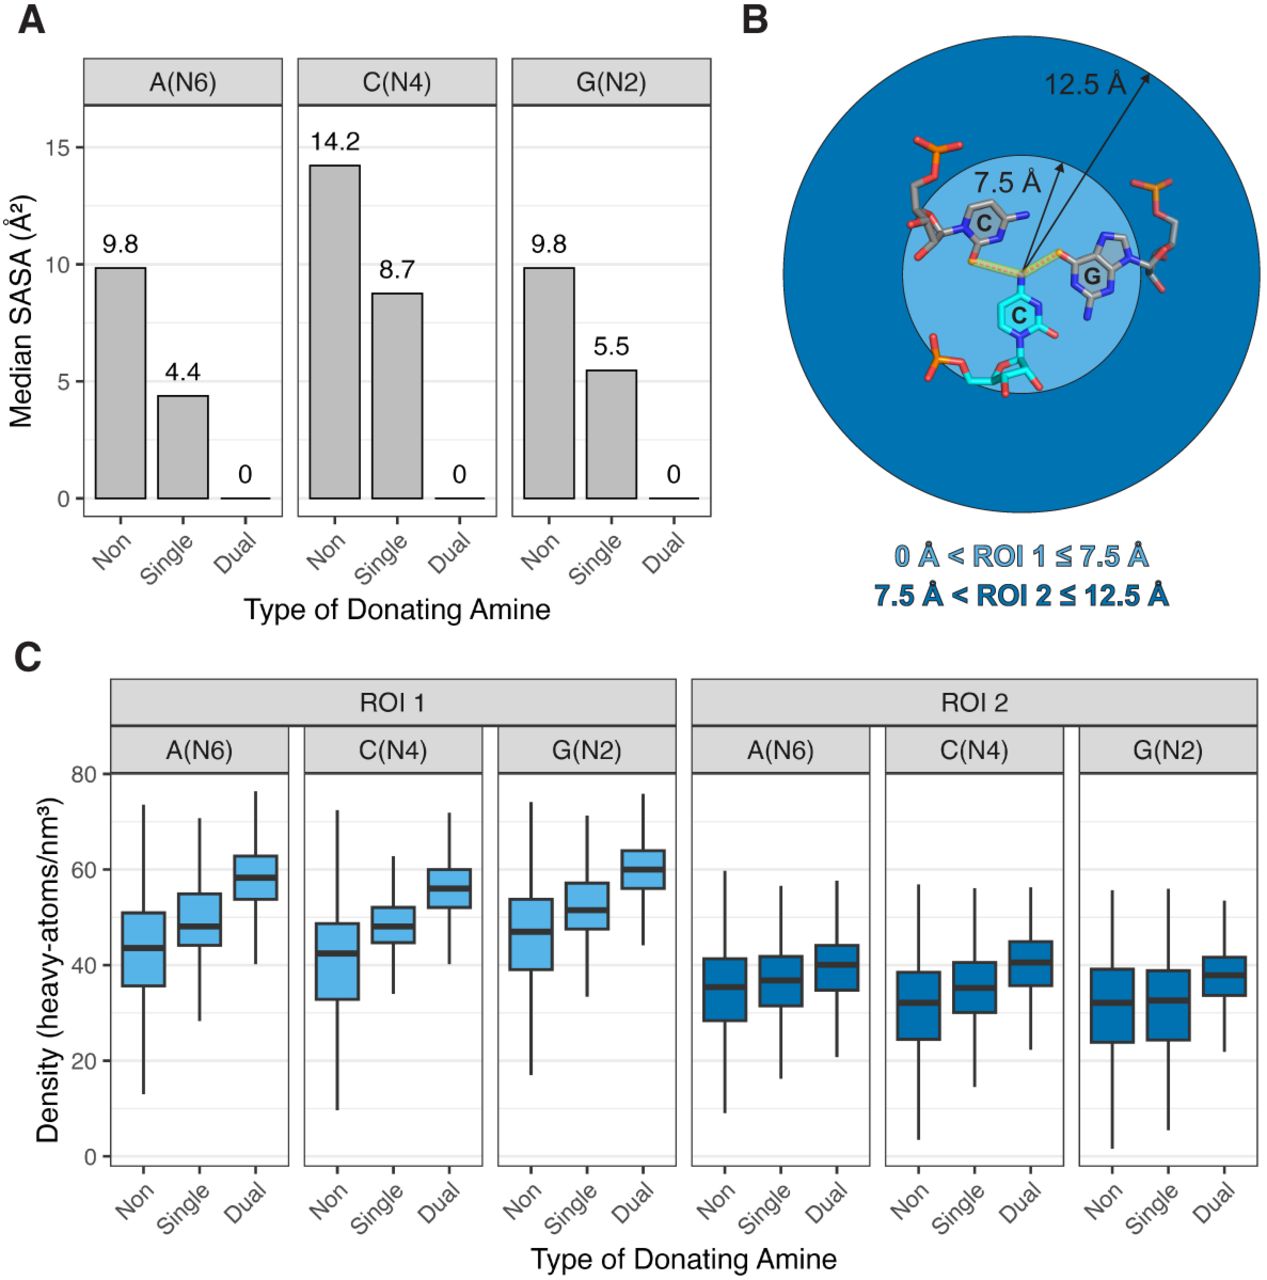
Amine solvent accessibility and surrounding density. (A) Median SASA values for nitrogens of non-, single-, and dual-donating amines from each type of nucleobase. Corresponding box plots are provided in Supplemental Figure S3A. (B) Diagram depicting the two regions of interest, ROI 1 (light blue) and ROI 2 (dark blue). The regions are centered about the amine nitrogen of interest, which in this example is C1092(N4) (PDB ID 1MMS, chain C) (Wimberly et al. 1999). (C) Density of heavy atoms within ROI 1 and ROI 2. All adjusted P-values for heavy atom density are <10−5 for the differences observed in the distributions within each of the six subplots (see Materials and Methods). Outliers were omitted from these plots but are included in Supplemental Figure S3C.




