


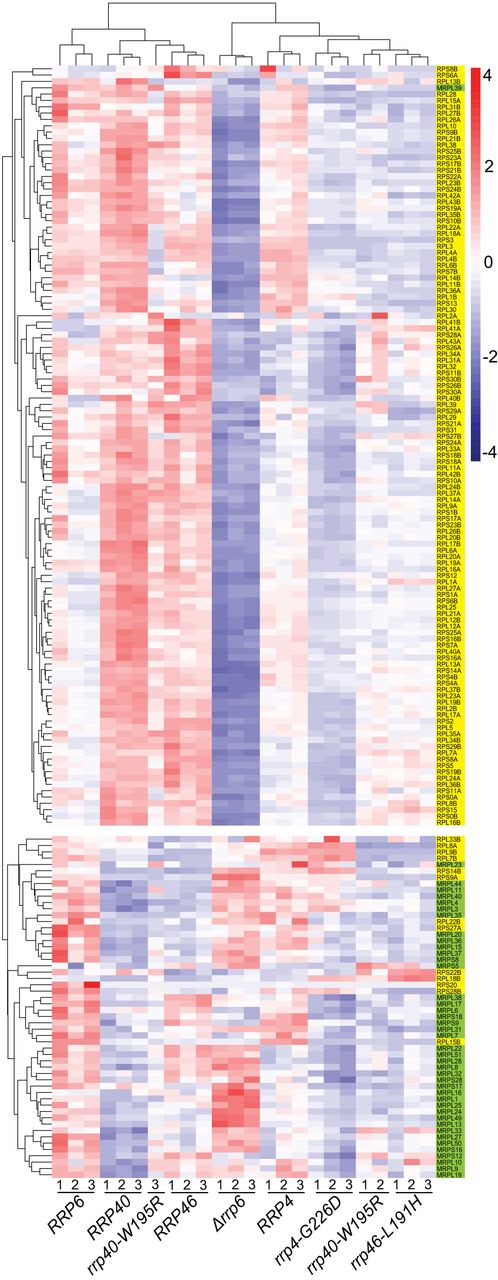
FIGURE 6.
Heat maps of RNA exosomopathy yeast mutants reveal broad changes in ribosomal protein gene transcript levels. Heat maps were generated with FPKM estimates of all annotated ribosomal protein RPS and RPL genes. Cytoplasmic and mitochondrial subunit genes are shaded in yellow and green, respectively. Gene expression estimates are scaled for heat map visualization, and coloring is a gradient of higher (red) to lower (blue) scaled values. The gene name for each RPS or RPL transcript is listed on the right.




