


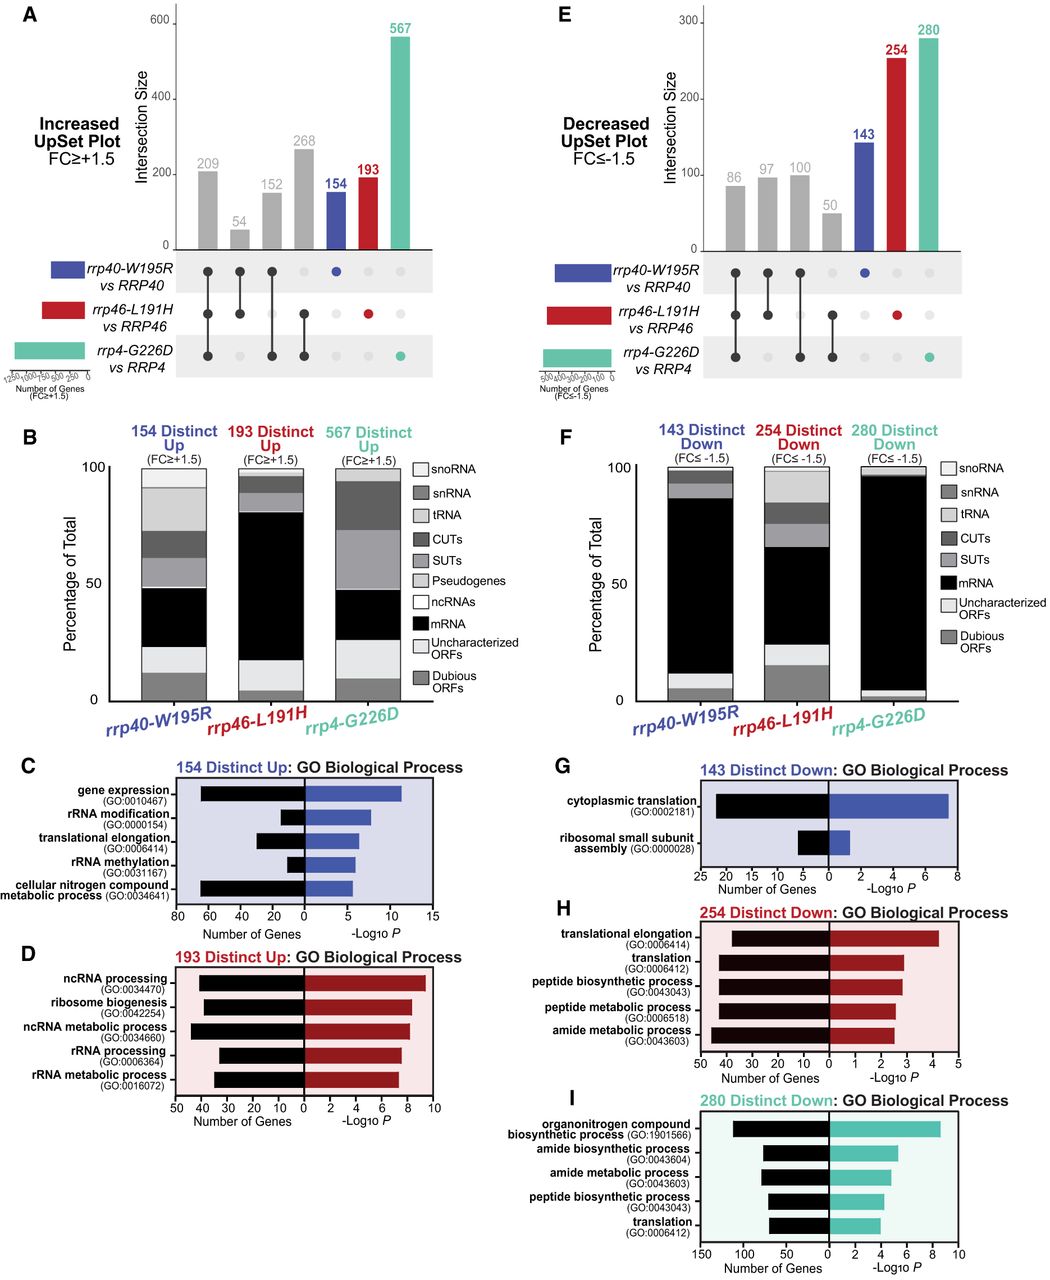
UpSet plots of differentially expressed transcripts in rrp4-G226D, rrp40-W195R, and rrp46-L191H cells reveal RNA targets that are uniquely impacted. UpSet plots were generated as in Figure 4. The intersections assessed here are transcripts significantly increased or decreased by 1.5-fold or more only in the rrp40-W195R data set (blue), the rrp46-L191H data set (red), or the rrp4-G226D data set (teal). The UpSet plot of significantly (A) increased (FC ≥ +1.5) transcripts or (E) decreased (FC ≤ −1.5) transcripts occurring solely in the rrp40-W195R, rrp46-L191H, or rrp4-G226D data set. Stacked bar percentages of the RNA types that comprise the (B) increased (Up) transcripts or (F) decreased (Down) transcripts identified only in the rrp40-W195R, rrp46-L191H, or rrp4-G226D data set. GO analysis for biological process of the (C) increased transcripts or (G) decreased transcripts occurring only in the rrp40-W195R data set; (D) increased transcripts or (H) decreased transcripts occurring only in the rrp46-L191H data set, and the (I) decreased transcripts occurring only in the rrp4-G226D data set. In C,D and G–I, black bars represent the number of transcripts that are linked to each biological process category, whereas colored bars represent the −log of the associated P-value for each GO term. All GO analyses were performed on coding RNAs (mRNA) and noncoding RNAs (tRNAs, snoRNAs, and snRNAs).




