


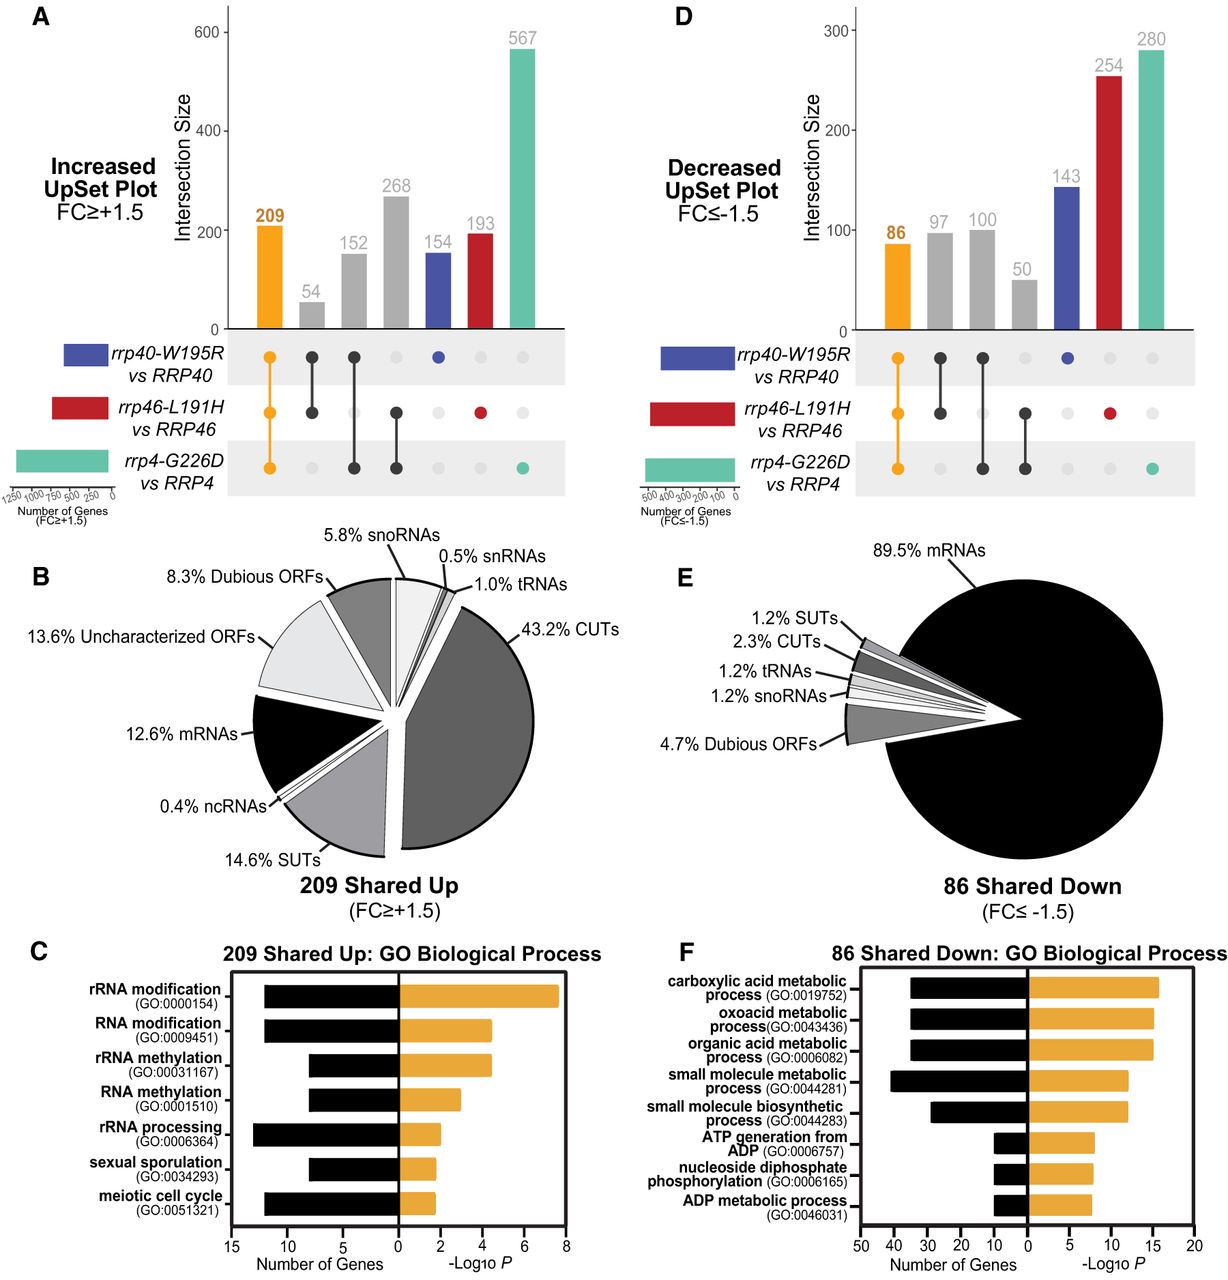
UpSet plots of differentially expressed transcripts in rrp4-G226D, rrp40-W195R, and rrp46-L191H cells reveal shared targets involved in metabolism and rRNA processing. The UpSet plot of (A) significantly increased (FC ≥ +1.5) transcripts or (D) significantly decreased (FC ≤ −1.5) transcripts within the rrp4-G226D, rrp40-W195R, and rrp46-L191H data sets. Pie chart of the RNA classes that comprise the intersection of shared (B) increased (Up) transcripts or (E) decreased (Down) transcripts (Up). Gene ontology (GO) analysis for the biological process of the shared (C) increased transcripts or (F) decreased transcripts. The sets of samples are color-coded: transcripts identified with FC ≤ −1.5 or FC ≥ +1.5 from differential expression analysis of rrp40-W195R versus RRP40 cells are colored blue, those of rrp46-L191H versus RRP46 cells are colored red, and those of rrp4-G226D versus RRP4 cells are colored teal. Black bars in C and F represent the number of transcripts that are linked to each biological process category, whereas orange bars represent the −log of the associated P-value for each GO term. GO analyses were performed on coding RNAs (mRNA) and noncoding RNAs (tRNAs, snoRNAs, and snRNAs).




