


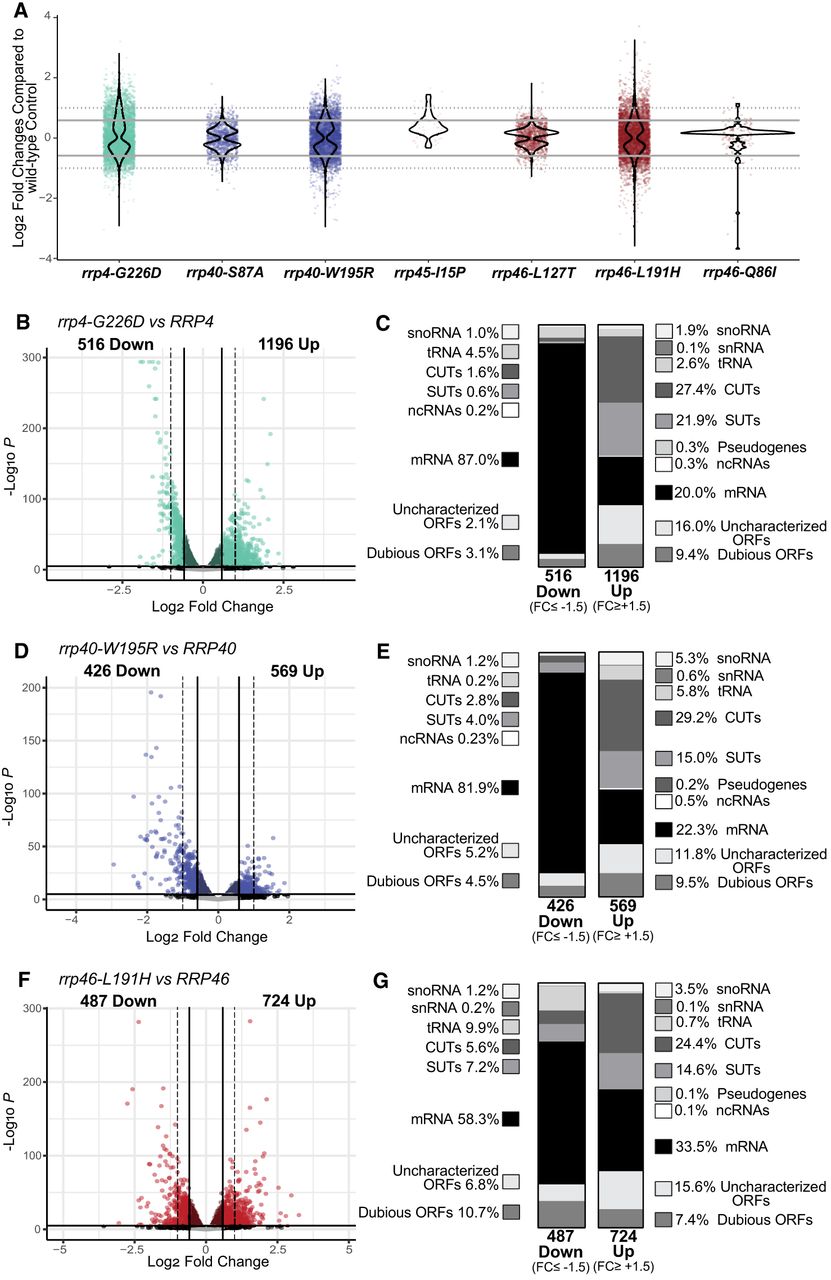
RNA-seq analysis of RNA exosomopathy mutant yeast models reveals large and distinct transcriptomic changes in the rrp4-G226D, rrp40-W195R, and rrp46-L191H mutant cells. (A) Violin plots showing the distribution of transcripts identified in differential analysis as significant (P < 0.05) in each mutant compared to the corresponding wild-type control. The y-axis shows the log2 fold change (LFC) for each transcript. The solid gray line demarcates a FC of +1.5 or −1.5 (LFC = 0.585 or −0.585). The dotted gray line marks a fold change (FC) of +2 or −2 (LFC = 1 or −1). (B, D, F) Volcano plots of the differentially expressed transcripts and classification of RNA types in rrp4-G226D, rrp40-W195R, and rrp46-L191H mutant cells as labeled. (C, E, G) Stacked bar graph of the percentages of different RNA classes within the differentially expressed transcripts in rrp4-G226D, rrp40-W195R, and rrp46-L191H mutant cells as indicated. RNA classes are shown as percentages and include messenger RNAs (mRNA), small nuclear RNAs (snRNA), small nucleolar RNAs (snoRNA), transfer RNAs (tRNA), cryptic unstable transcripts (CUTs), stable unannotated transcripts (SUTs), other noncoding RNA (ncRNA; e.g., TLC1), pseudogenes, and uncharacterized or dubious open reading frames (ORFs). Vertical lines mark FC values of ±1.5 (straight line) and ±2 (dotted line).




