


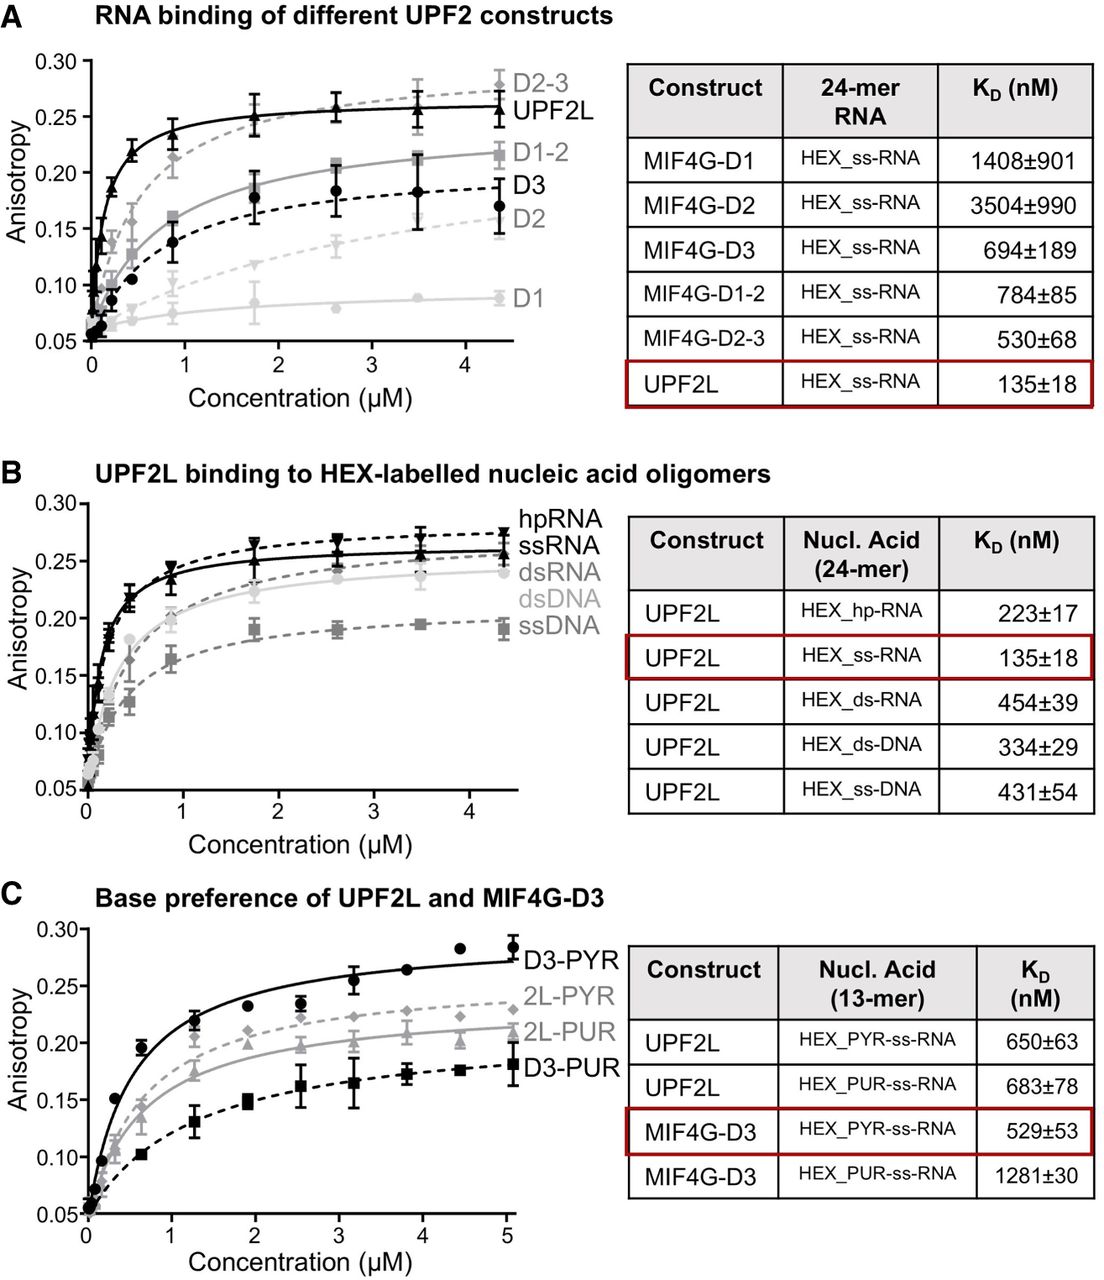
Nucleic acid binding of UPF2 variants determined by fluorescence anisotropy. (A, left) Fluorescence anisotropy binding curves of UPF2 constructs to HEX-labeled 24 nt ss-RNA. (Right) Measurements were performed in triplicate and error bars plotted via standard deviation before fitting a single component binding equation to calculate KD values. (B) Binding curves of UPF2L to HEX-labeled 24 nt ss- and ds-RNA and DNA constructs are shown at the left. (C) Binding curves of UPF2L and MIF4G-D3 to HEX-labeled 13 nt pyrimidine-rich (PYR) or purine-rich (PUR) ss-RNA constructs are shown at the left. (A–C) KD values are listed in the table at the right) with highest affinity highlighted by a red box. Sequences are listed in Supplemental Table S1.




