


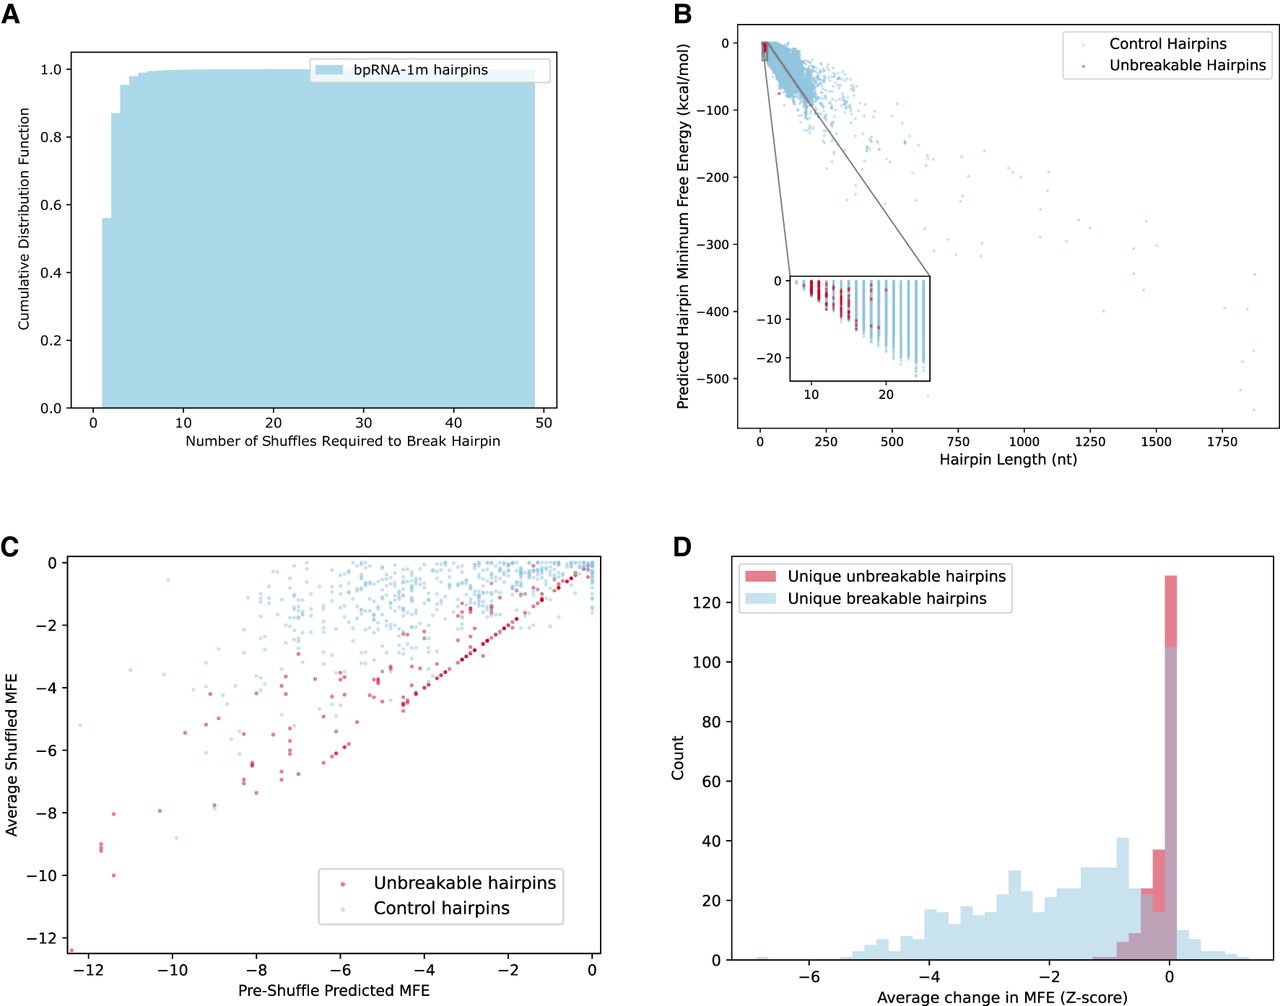
(A) The cumulative distribution function describing the number of dinucleotide shuffles applied to hairpin sequences such that the shuffled sequence will result in a non-hairpin sequence by secondary structure prediction. (B) A scatterplot comparing unbreakable hairpins to control hairpins, such that each dot corresponds to a hairpin sequence; the x-axis is the hairpin length, including both the stem and hairpin loop, and the y-axis is the predicted minimum free energy of the structure. (C) A scatterplot showing the average of five minimum free energy values (in kcal/mol) of unbreakable and breakable hairpins before and after Altschul–Erickson dinucleotide shuffling, where the diagonal represents no change in hairpin minimum free energy. (D) A representation of the same results as C, shown as a histogram representing the change in minimum free energy as a Z-score.




