


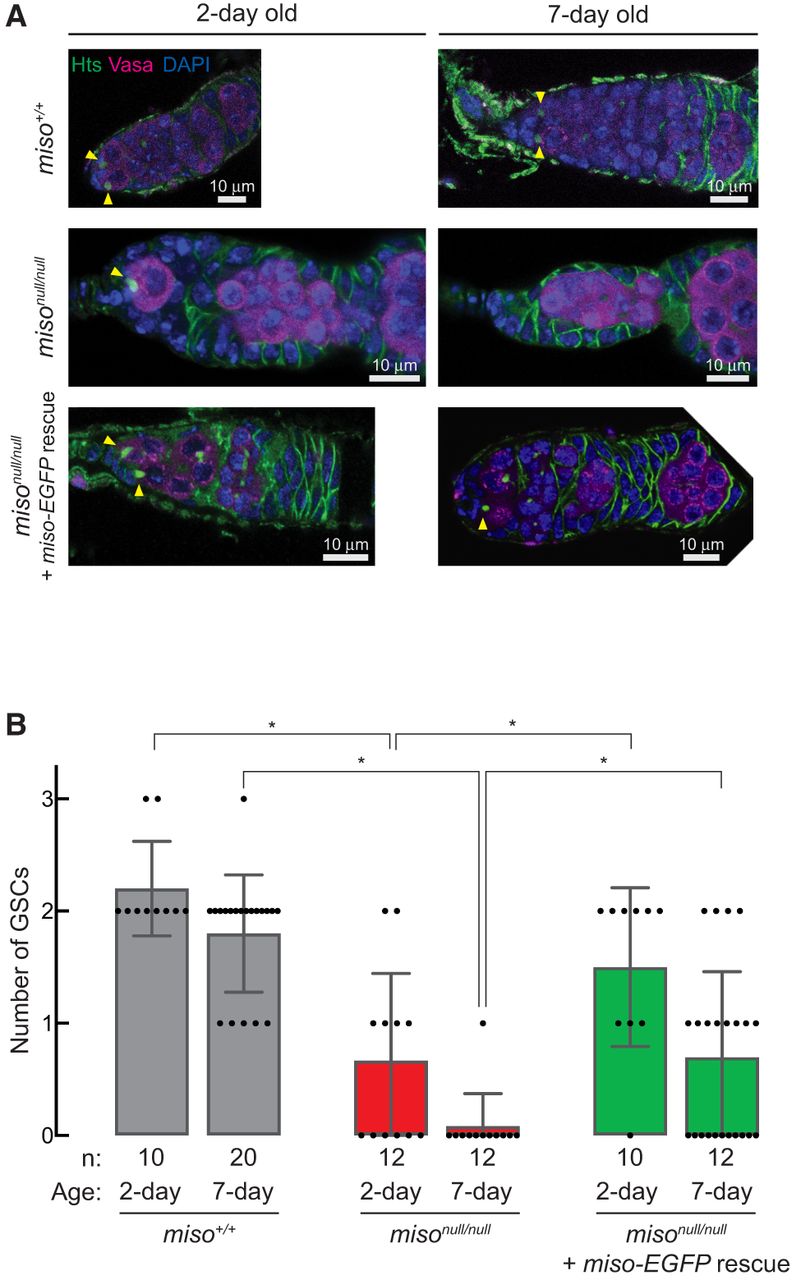
FIGURE 4.
Reduced GSC numbers in miso mutant females. (A) Confocal images of germaria stained with anti-Hts (spectrosome) and anti-Vasa (germline cells) antibodies. Yellow triangles indicate GSCs, which have round spectrosome contacting cap cells at the anterior tip. Scale bar, 10 μm. (B) Quantification of GSCs per germarium. Mean ± SD. P-value < 0.05 (Student's t-test, unpaired, two-tailed) is indicated by *.




