


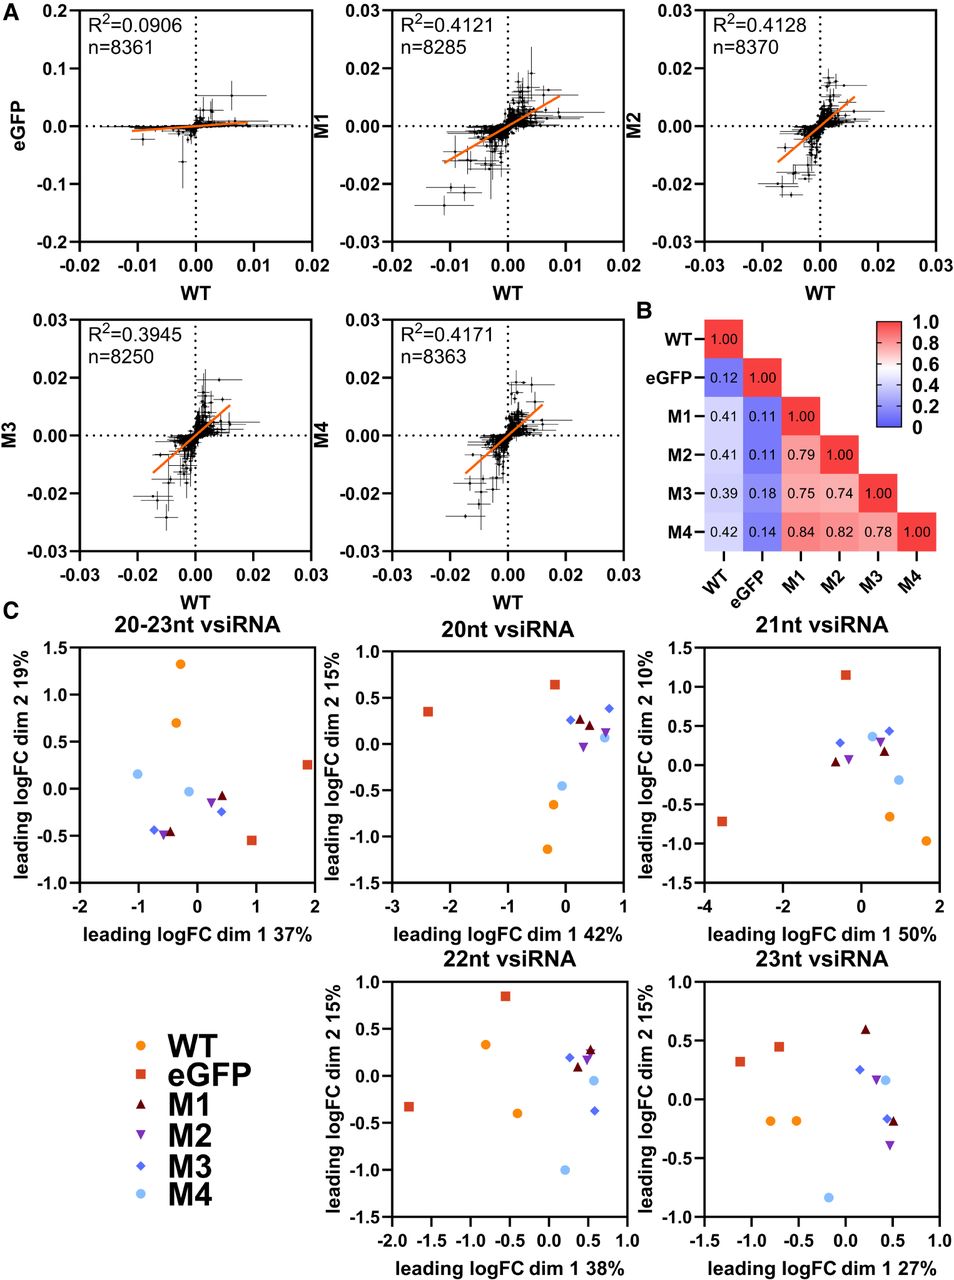
Mutations in the PAZ domain of Aaeg Dcr2 change the position and magnitude of cleavage over the SFV genome and virus-derived small RNA populations compared to WT Dcr2. Samples from Figure 4 were analyzed as follows. (A) Scatter plots showing normalized differential coverage (di) for each position in the SFV genome. Each panel compares WT Dcr2 with no Dcr2, an eGFP expressing Dcr2 negative treatment, or Dcr2 PAZ domain mutants M1–M4. The linear regression line is depicted within each plot, with the R2 value indicating the fit of the model. The number of data points (n) with di > 0 over the SFV genome used for the calculation is shown on each graph. (B) Heatmap displaying pairwise R2 values from the linear regressions, comparing the similarity of differential coverage profile between treatments, as indicated. (C) Multidimensional scaling (MDS) plots representing the relationships between different size classes of vsiRNA reads from WT Dcr2, eGFP control, and Dcr2 PAZ domain mutants M1–M4. Each plot corresponds to a specific size class of SFV-derived small RNA: 20, 21, 22, and 23 nt, as well as a combined plot of 20–23 nt. The axes represent the leading two log fold change (logFC) dimensions and the percentage of variation indicated.




