


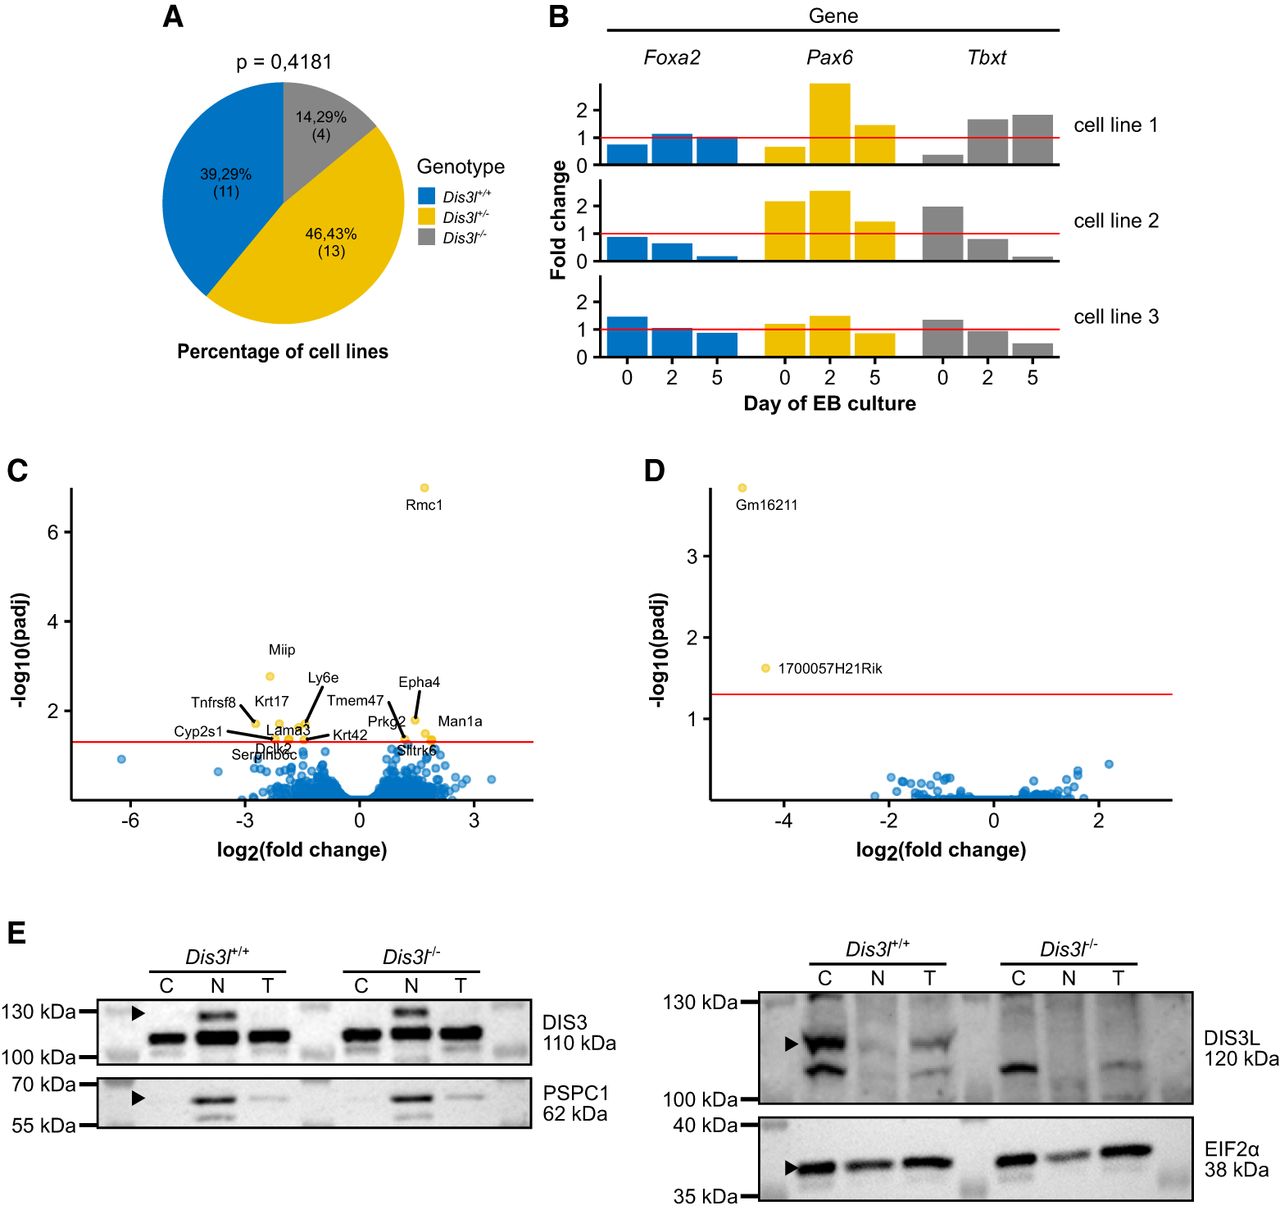
Phenotype and transcriptome analysis of Dis3l KO ES cells. (A) Genotype distribution of ES cell lines derived from blastocysts from Dis3l+/− × Dis3l+/− matings. (B) Transcript level fold change of three germ layer-specific differentiation factors: Foxa2, Pax6, and Tbxt, in EBs through 5 days of culture in three obtained Dis3l−/− ES cell lines related to mean result of three WT cell lines, obtained by RT-qPCR experiment. The red horizontal line marks a fold change of 1, meaning no change compared to WT. (C) Differential expression analysis of protein-coding genes identified in RNA-seq results of three Dis3l−/− and three Dis3l+/+ ES cell lines. Positive and negative log2(fold change) value means upregulation and downregulation, respectively, of transcript in KO cells. Red horizontal line marks adjusted P-value of 0.05 with transcripts above it considered significantly changed in Dis3l−/− ES cell lines compared to Dis3l+/+ ones. (D) Differential expression analysis of long noncoding RNAs genes identified in RNA-seq results of three Dis3l−/− and three Dis3l+/+ ES cell lines. Positive and negative log2(fold change) value means upregulation and downregulation, respectively, of transcript in KO cells. Red horizontal line marks adjusted P-value of 0.05 with transcripts above it considered significantly changed in Dis3l−/− ES cell lines compared to Dis3l+/+ ones. (E) Western blot analysis of the presence and localization of DIS3 and DIS3L proteins in the nucleoplasm (N), cytoplasm (C), and total protein extract (T) fractions of Dis3l+/+ and Dis3l−/− ES cells. Black bars with molecular weight values (in kilodaltons) on the left mark protein ladder band sizes, protein names with predicted size values on the right mark the targets of used antibodies, black arrowheads mark specific bands detected, PSPC1 protein served as a nucleoplasm fraction control, and EIF2α served as cytoplasm fraction control.




