


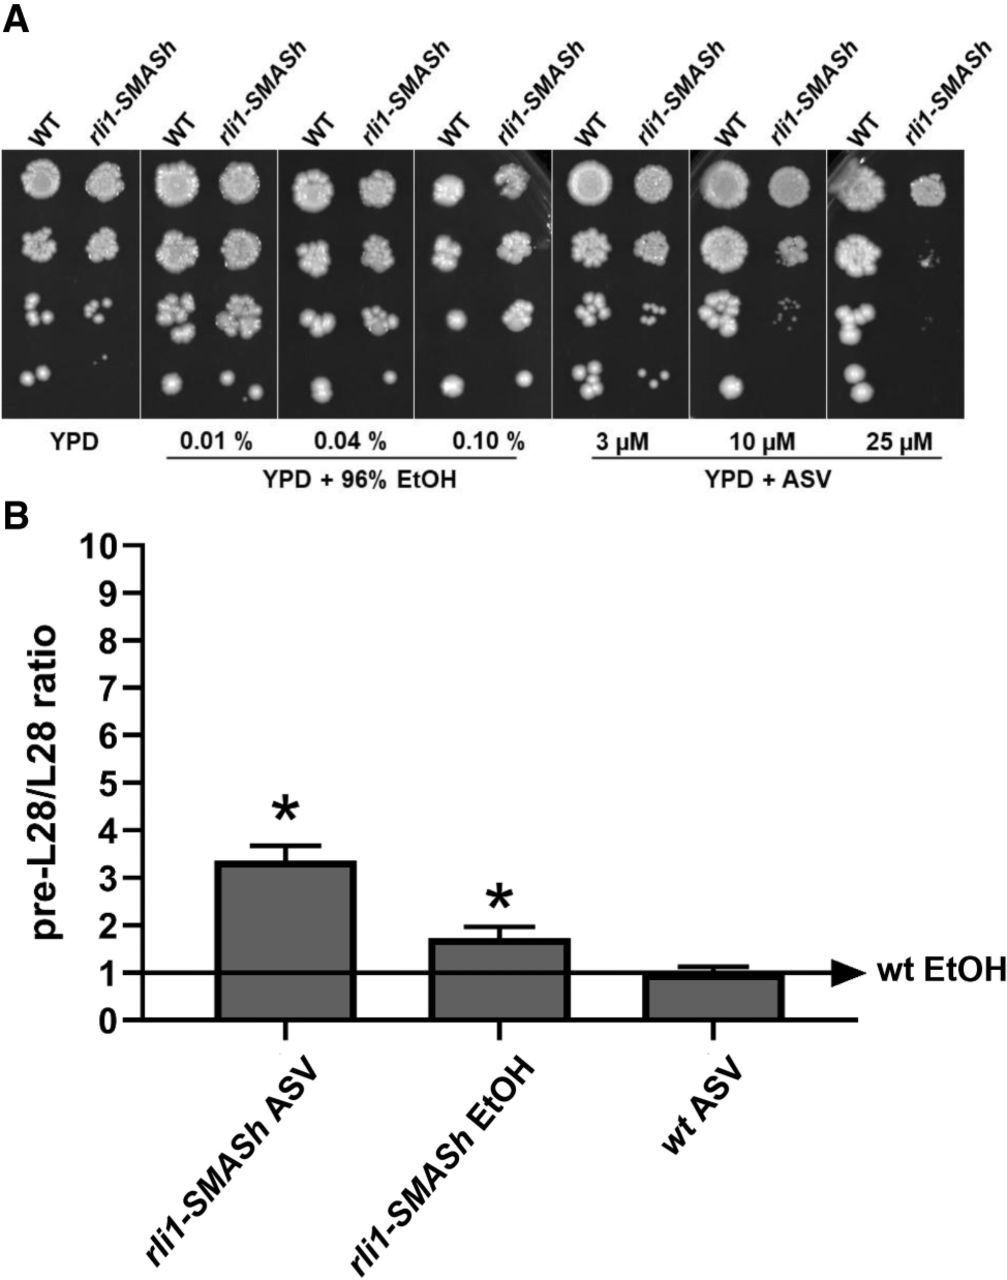
Verification of NMD defect in rli1-SMASh. (A) Growth inhibition of cells expressing rli1-SMASh in different ASV concentrations. Cells in logarithmic phase (OD550 nm = 0.5) were spotted in serial 1:10 dilutions on YPD agar with the indicated additions. ASV was added to the indicated final concentrations. Control plates contain the ethanol solvent at the same concentrations as the plates with ASV at the corresponding concentrations. (B) qPCR of RPL28 mRNA. Procedure and designations as in Figure 4. Each tested strain is shown on the x-axis. All samples are shown as relative level of the targeted mRNA species compared to the wt in medium plus 0.04% ethanol but without ASV. ASV was added to 10 µM where indicated. The baseline value of one, from wt in medium plus 0.04% ethanol, is depicted as an arrow. The 1.7-fold change for rli1-SMASh without ASV is marked with (*), since even though it does not meet the stricter criteria for being a true positive of a greater than twofold change, it is statistically significant.




