


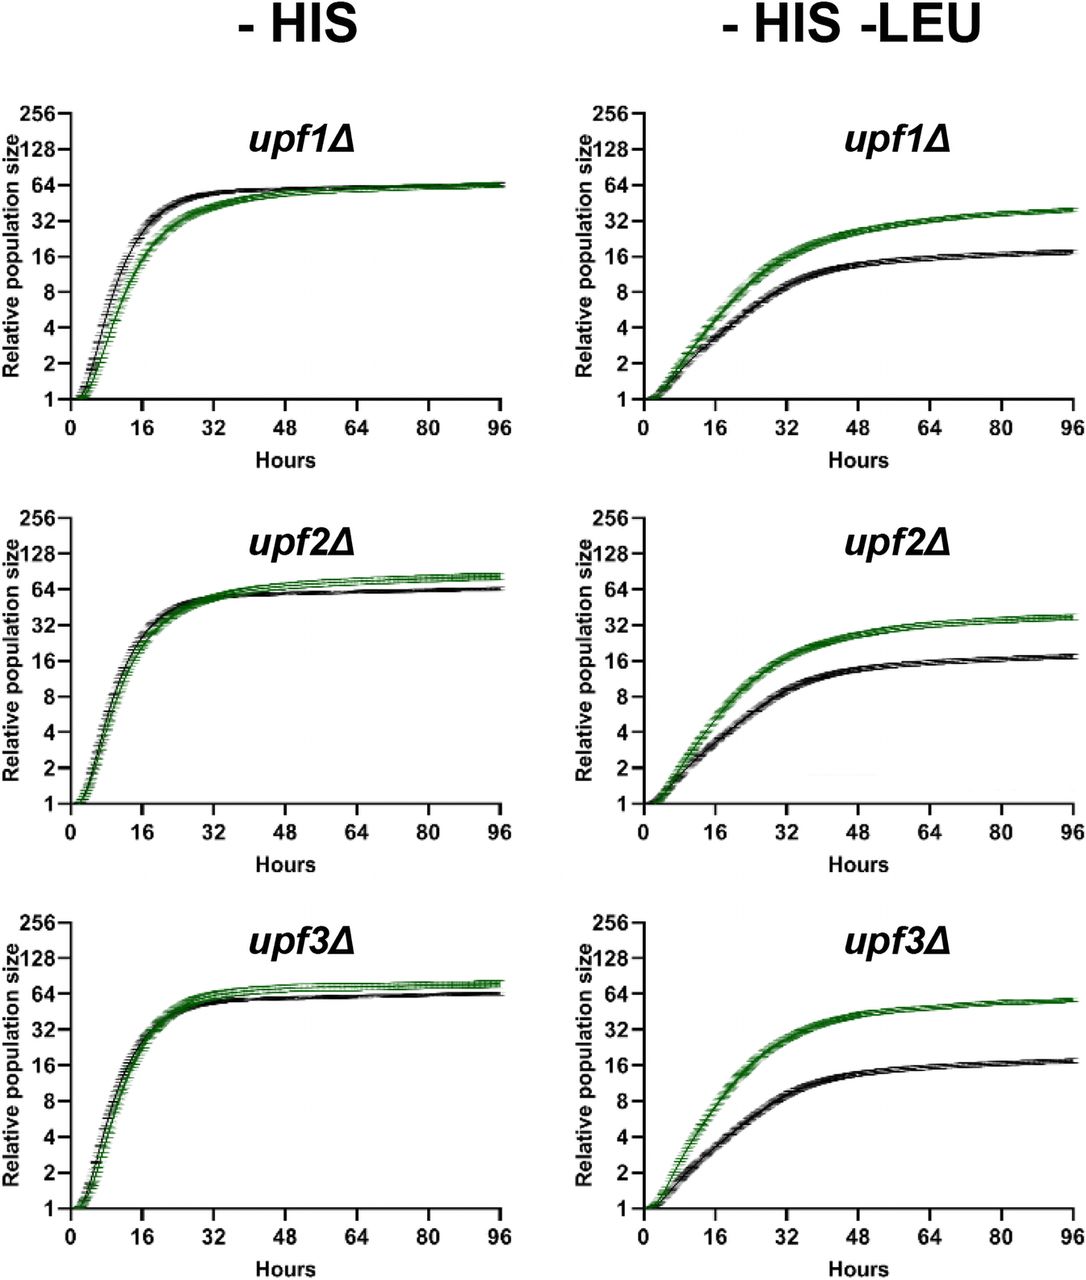
Growth curves of strains with deleted core NMD factors using pALR1_LEU2_PGA1. Growth curves of core NMD factors from the secondary screen of the first library. Green curve, mutant; black curve, wt. Each growth curve was normalized to the initial population size. Growth measurements are presented as mean ± standard error of the mean for each time point for 12 biological replicates. All the core mutants passed the criteria for significance (Q value of <0.05, an interaction score of higher than 2 × median absolute deviations from the median of the control, and a coefficient of variation of ≤0.35). Methodology for calculating the interaction score can be found in Materials and Methods.




