


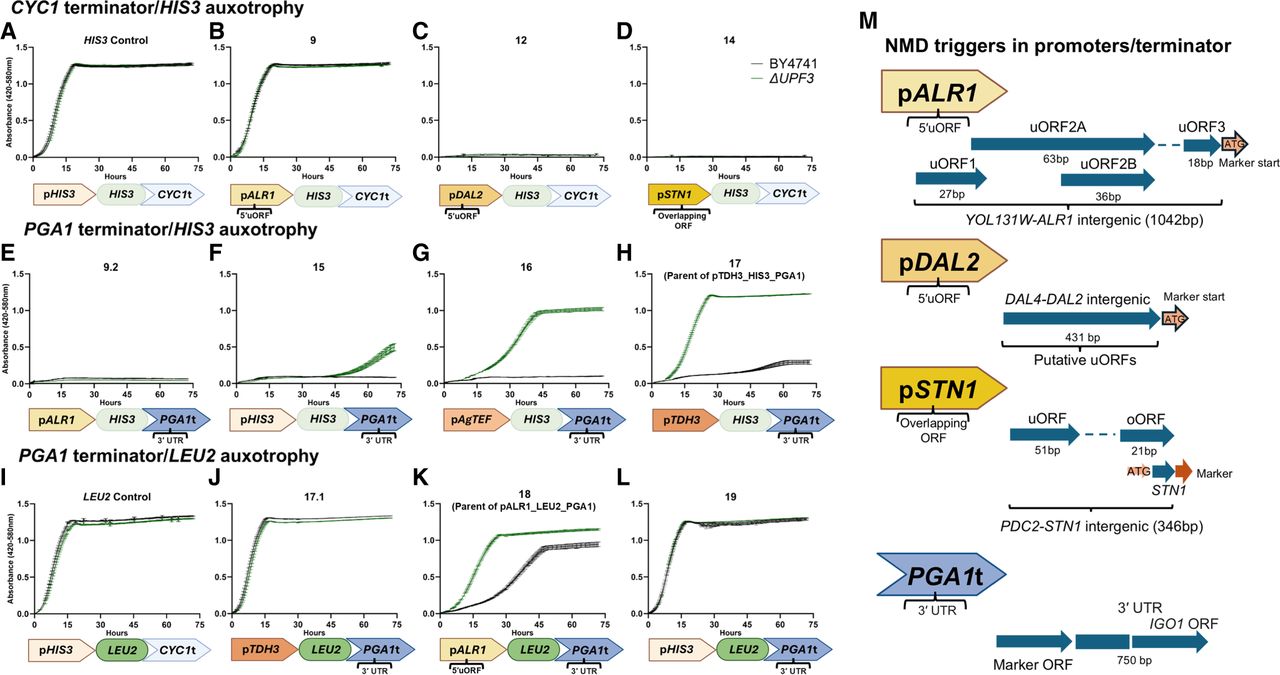
NMD monitoring based on auxotrophic markers. Various plasmids carrying combinations of promoters, markers, and terminators were transformed into BY4741 and isogenic upf3Δ. Growth measurements are presented as mean ± standard error of the mean for each time point. Optical density values were produced by Bioscreen for each strain in biological triplicates. The number on top of each graph designates the specific combination of regulative elements used to construct a given plasmid. These are shown schematically at the bottom of each panel, and in more detail in panel M. Plasmids that were used to derive the plasmids for screening are shown with the name of the derived plasmid in parentheses.




