


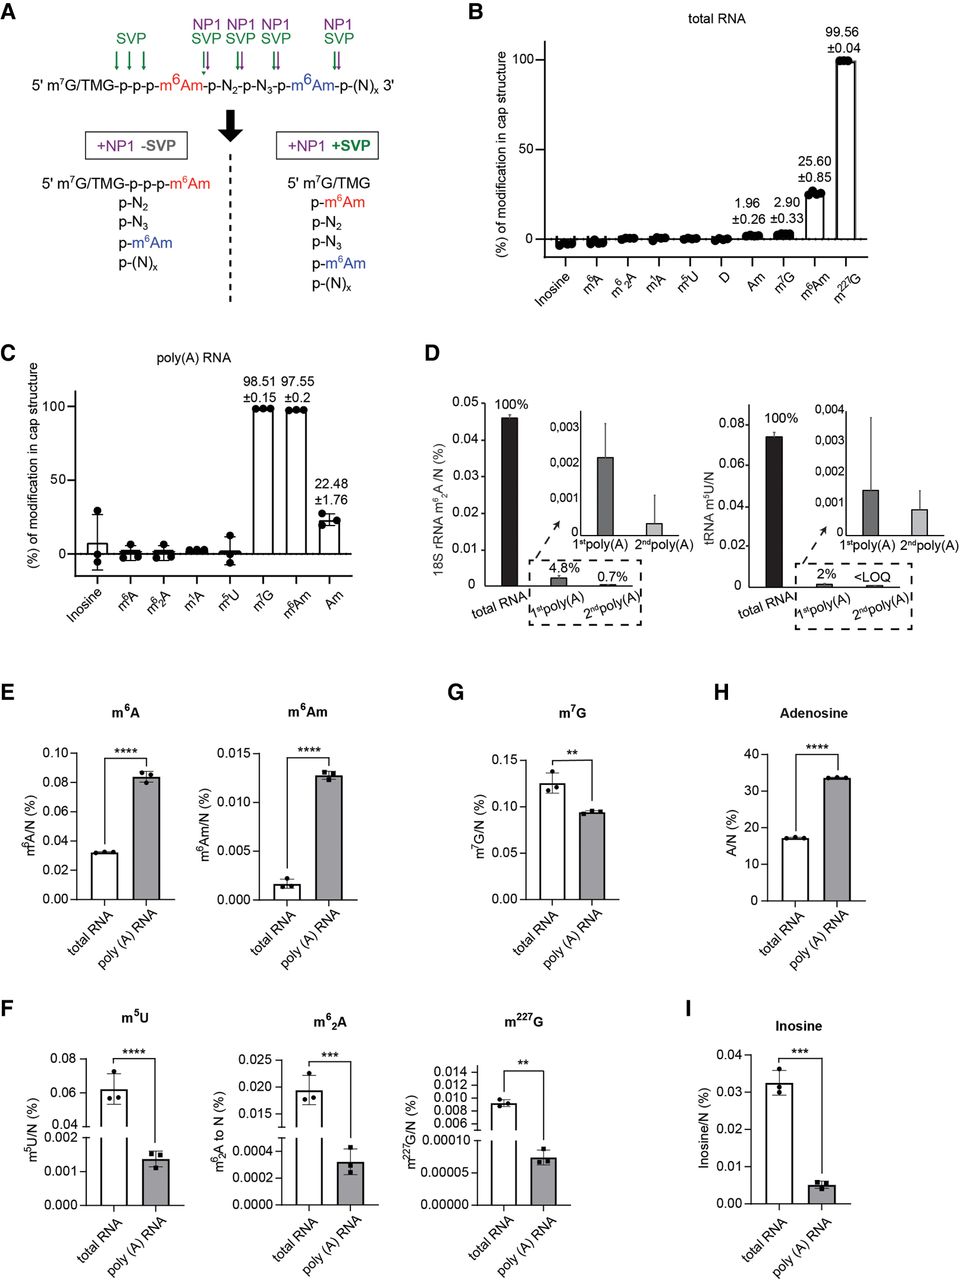
Quantitative LC-MS/MS measurements of 5′ terminal and internal modifications in total and poly(A) RNA fraction. (A) Schematic diagram illustrating the strategy for the detection of cap + internal (+NP1 +SVP) and internal (+NP1 −SVP) m6Am levels. NP1 cleaves after each nucleotide, releasing 5′ monophosphorylated nucleotides (pN), but is unable to cleave the triphosphate bond between the RNA cap (m7G or m227G [TMG] for mRNA and snRNA, respectively) and the first nucleotide. SVP hydrolyses nucleotide polyphosphates and can therefore digest the triphosphate bond, releasing cap-linked m6Am. The green and red arrows indicate the cleavage sites of SVP and NP1, respectively. Cap-linked m6Am in green, internal m6Am in red. (B) Nucleoside modification content in the cap structure of total RNA in HEK293T cells (n = 3). (C) Nucleoside modification content in the cap structure of poly(A)RNA after two steps of poly(A) selection in HEK293T cells (n = 3). (D) Quantification of m62A and m5U ratios in total RNA and poly(A) RNA enriched by one or two steps of poly(A) RNA isolations. The levels of nucleoside modifications were normalized to the total molar amount of canonical nucleosides N (N = C + U + G + A). n = 10. Data are average ± SD. <LOQ = under the limit of quantification. (E) Measurements of m6A and m6Am. (F) Relative levels of m5U, m62A, and m227G, marks specific for tRNA, 18S rRNA, and mature sm-class of snRNAs, respectively. Relative levels of m7G (G), adenosine (H), and inosine (I). The levels of nucleoside modifications were normalized to the total molar amount of canonical nucleosides N (N = C + U + G + A). n = 3, data are mean ± SD, unpaired two-tailed t-test. (*) P < 0.05, (**) P < 0.01, (***) P < 0.001. Source data are available online for this figure.




