


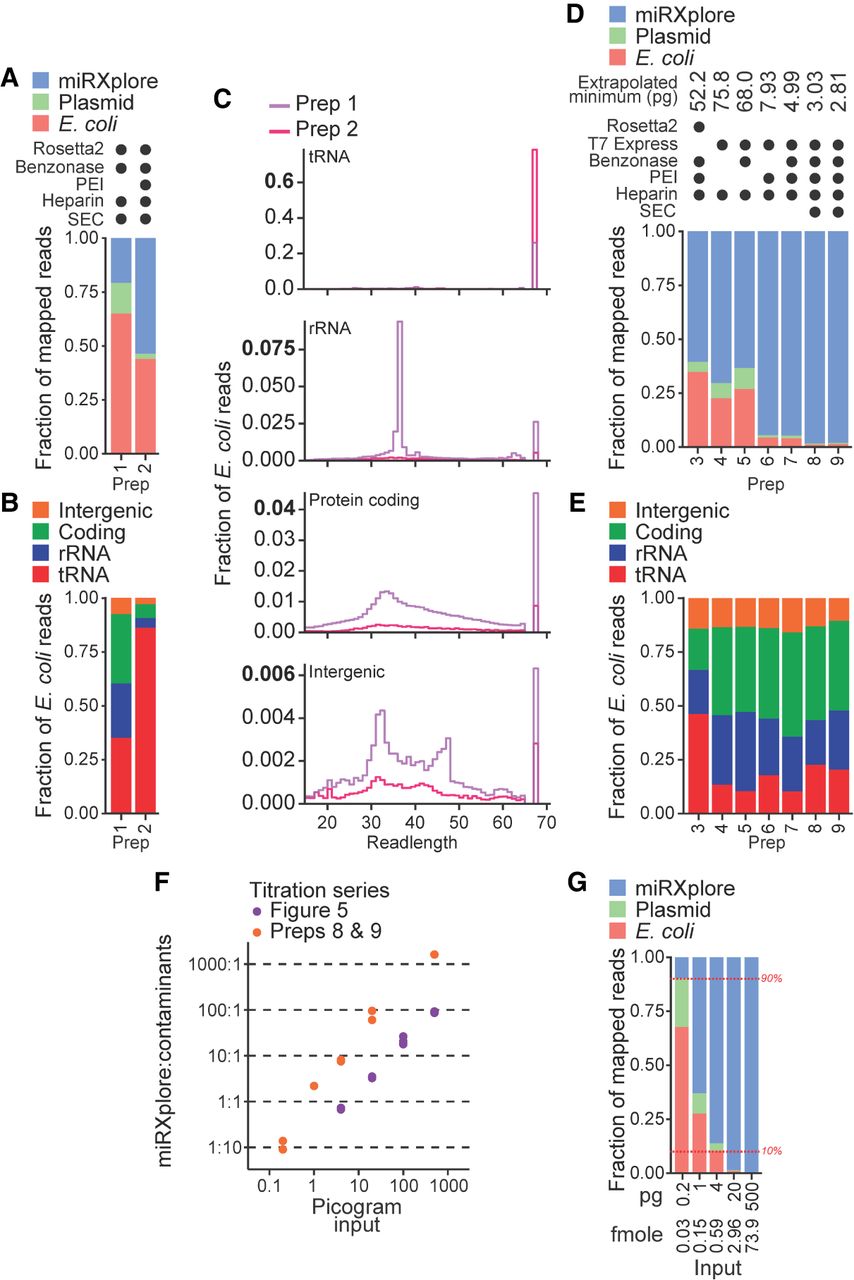
Improvements in BoMoC protein purification. (A) Composition bar plots of mapped reads, excluding reads 17 nt or shorter and adapter-mapping reads, for miRXplore cDNA libraries made using 20 pg input RNA and different protein purifications (preps). Variations to protein purification (Supplemental Fig. 4) are described using filled circles to indicate the presence of a variable E. coli strain or purification step in each prep. Prep 1 and 2 were BoMoC W403AF753A and were purified after splitting the same cell lysate in half. (B) Subcategories of read mapping for the E. coli nucleic acid category in (A). (C) Read length distribution plots of the subcategories of read mappings in (B). Note that the y-axis for each plot has a different scale. (D,E) Composition bar plots as described for (A,B) for cDNA libraries from 20 pg miRXplore input. In addition to 20 pg miRXplore RNA input, a 500 pg miRXplore RNA input cDNA library was produced; the pair was used to extrapolate minimum input that would recover 9:1 miRNA:E. coli and expression-plasmid reads, with that amount indicated at top. Preps 3 and 8 were BoMoC F753A; preps 4, 5, 6, and 7 were BoMoC W403AF753A; and prep 9 was BoMoC WT. (F) Titration results for data from Figure 5 and additional results for cDNA libraries prepared using preps 8 and 9 for 3′-labeling and cDNA synthesis, respectively. The y-axis shows the read count ratio of miRXplore:contaminants (i.e., E. coli and expression plasmid sequences). Both axes are on a log10 scale. (G) Composition bar plots as described for (A), here for libraries constructed with 0.2, 1, 4, 20, and 500 pg of miRXplore RNA and using preps 8 and 9 for 3′-labeling and cDNA synthesis, respectively. One representative replicate from the data in (F) was used for the bar plot. Red horizontal dashed lines (10% and 90%) are included as visual aids.




