


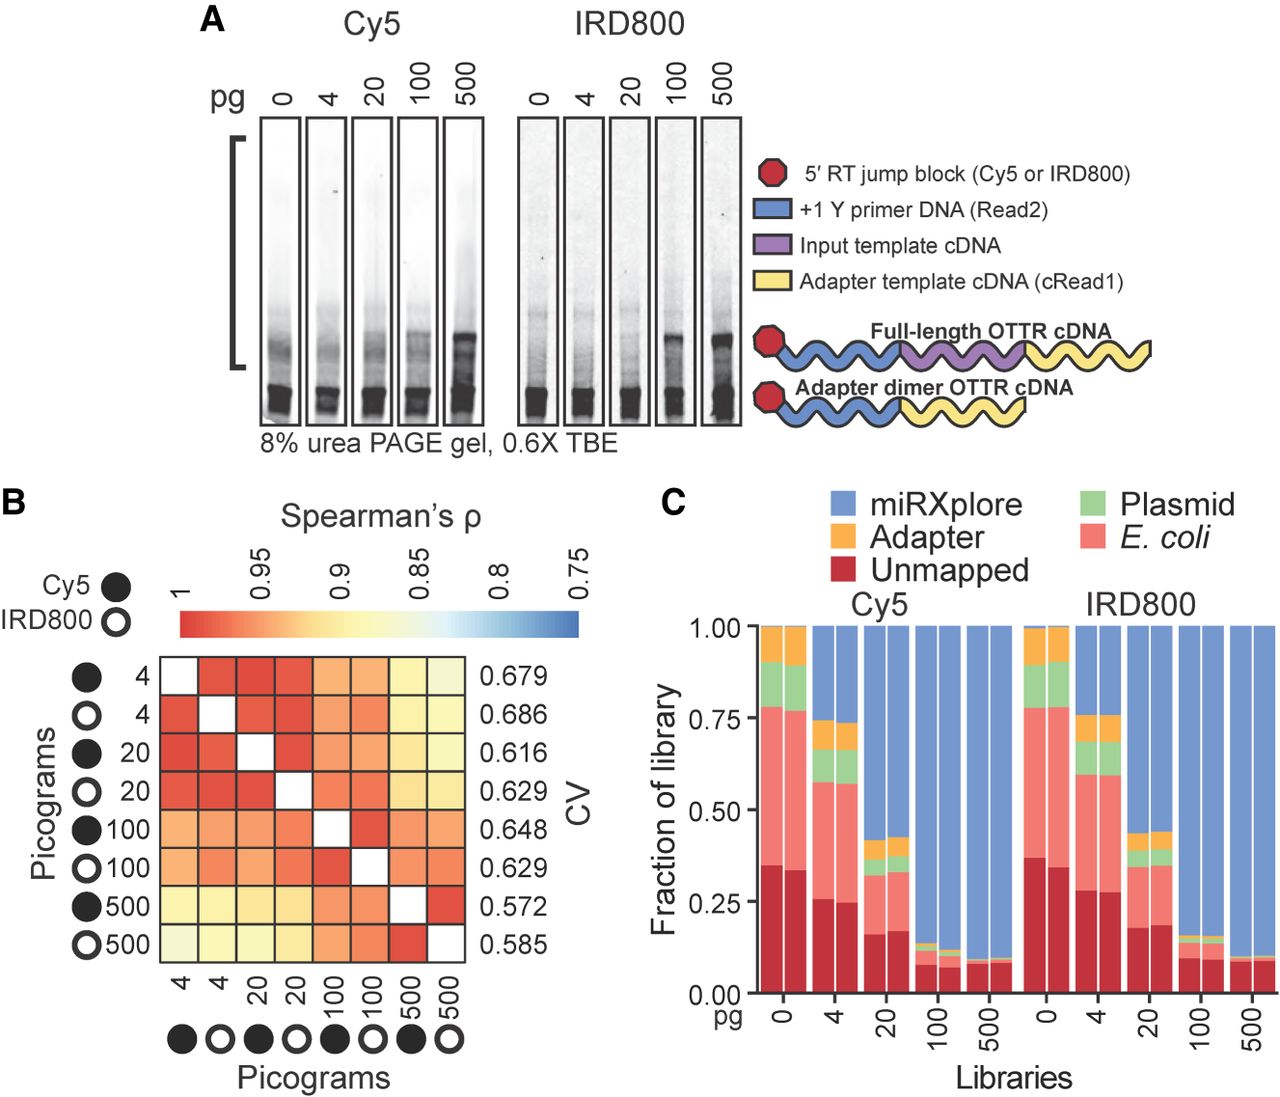
OTTR performance across different amounts of input RNA. (A) Representative replicates of OTTR cDNA resolved by 8% dPAGE and detected using the 5′ Cy5 or IRD800 primer fluorophore, with miRXplore miRNA input in pg and 5′ primer fluorophore denoted above. cDNA product size-selection range is denoted by the left open bracket (black). On the right, adapter-dimer and miRXplore OTTR cDNA products are indicated with schematics using the color key from Figure 1. (B) Correlation matrix of miRNA read counts from cDNA libraries produced using a titration from 4 to 500 pg total miRXplore RNA. Replicate Cy5 and IRD800 libraries for each miRNA input amount were averaged by their counts per million reads (CPM) and compared by Spearman's correlation coefficient (ρ). miRXplore miRNA input in pg, 5′ primer fluorophore, and library-wide CV are denoted. (C) Composition bar plots of the fraction of the total library, excluding reads 17 nt or shorter, that mapped to miRXplore miRNA, OTTR adapter sequences, BoMoC expression plasmid, or E. coli genome, or were unmapped. Individual replicate libraries are presented in pairs.




