


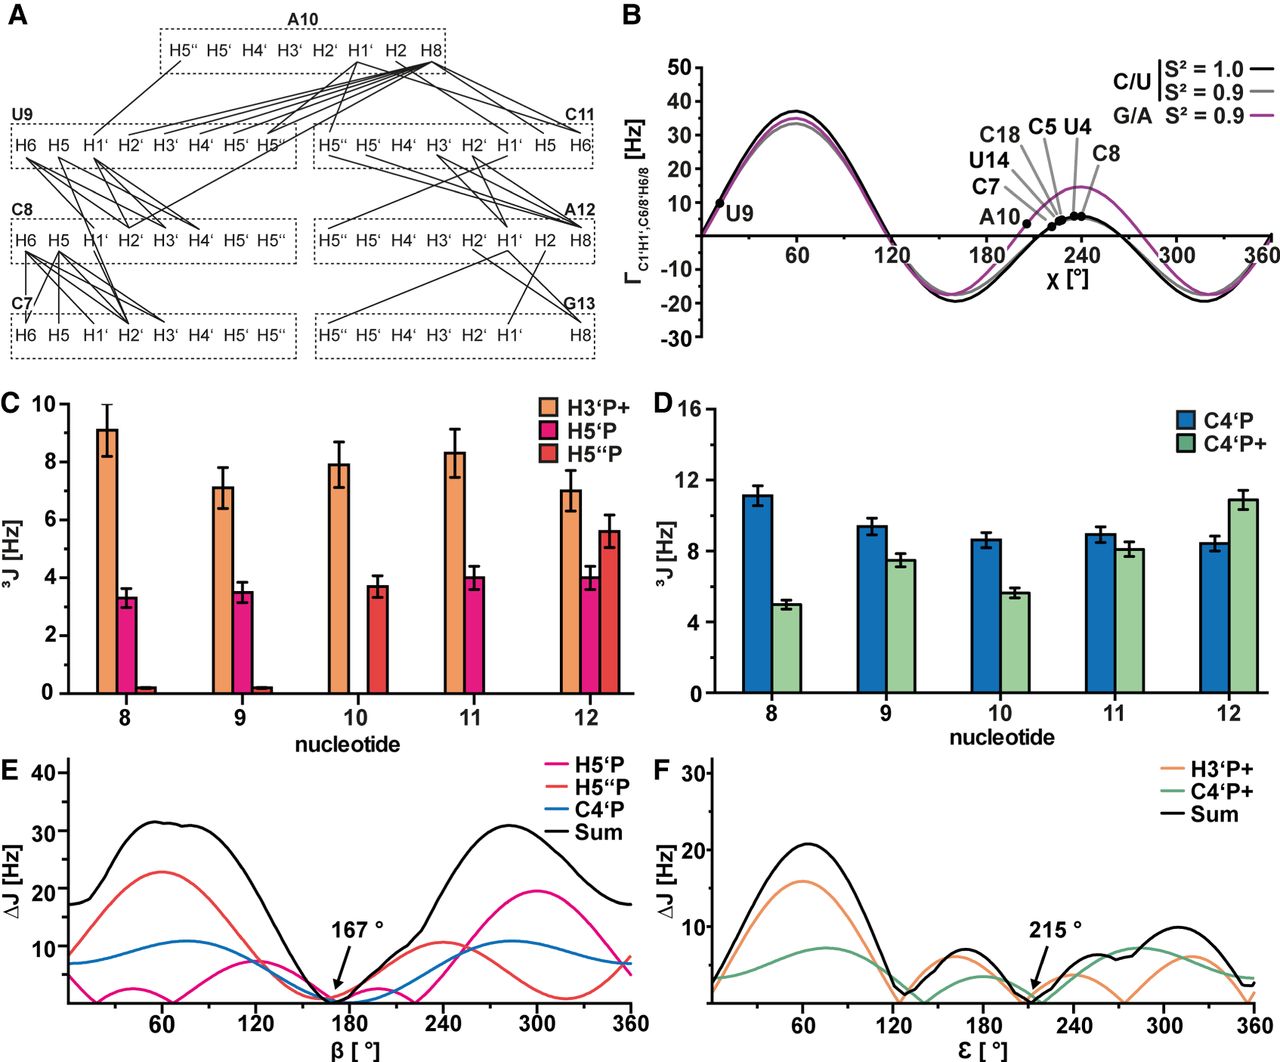
NOE contacts and dihedral angles of the s2m_omicron loop nucleotides. (A) Interresidual NOEs within the loop of s2m_omicron. All atoms within 1 nt are shown in a dashed box, and each NOE is represented
by a line between two atoms. (B) Dipole(H1′,C1′)-dipole(H6/8,C6/8)-CCRs determined via the Γ-HCN experiment plotted against the glycosidic angle (χ) based
on the theoretical parametrization. Separate plots are shown for the purines (violet) and the pyrimidines (black, gray). Experimentally
determined rates were fitted to the theoretical curves (solid lines) and are shown as dots. Nucleotide names are annotated.
(C) 3J H-P couplings determined via the PFIDS experiment.  couplings are shown in orange,
  couplings are shown in magenta, and
  couplings are shown in red. A 10% error was estimated. (D) 3J C-P couplings determined via the qHCP experiment.
  couplings are shown in blue, and
  couplings are shown in green. A 5% error was estimated. (E) Determination of the backbone angle β for nucleotide U9 based on
  couplings (magenta),
  couplings (red), and
  couplings (blue). (F) Determination of the backbone angle ε for nucleotide U9 based on
  couplings (orange) and
  couplings (green). Each curve corresponds to the experimentally determined coupling minus the theoretical value of the Karplus
parametrization plotted against the angle. The sum of these curves is shown in black. The minimum is annotated and gives the
angle that best fits all used couplings.
couplings (green). Each curve corresponds to the experimentally determined coupling minus the theoretical value of the Karplus
parametrization plotted against the angle. The sum of these curves is shown in black. The minimum is annotated and gives the
angle that best fits all used couplings.




