


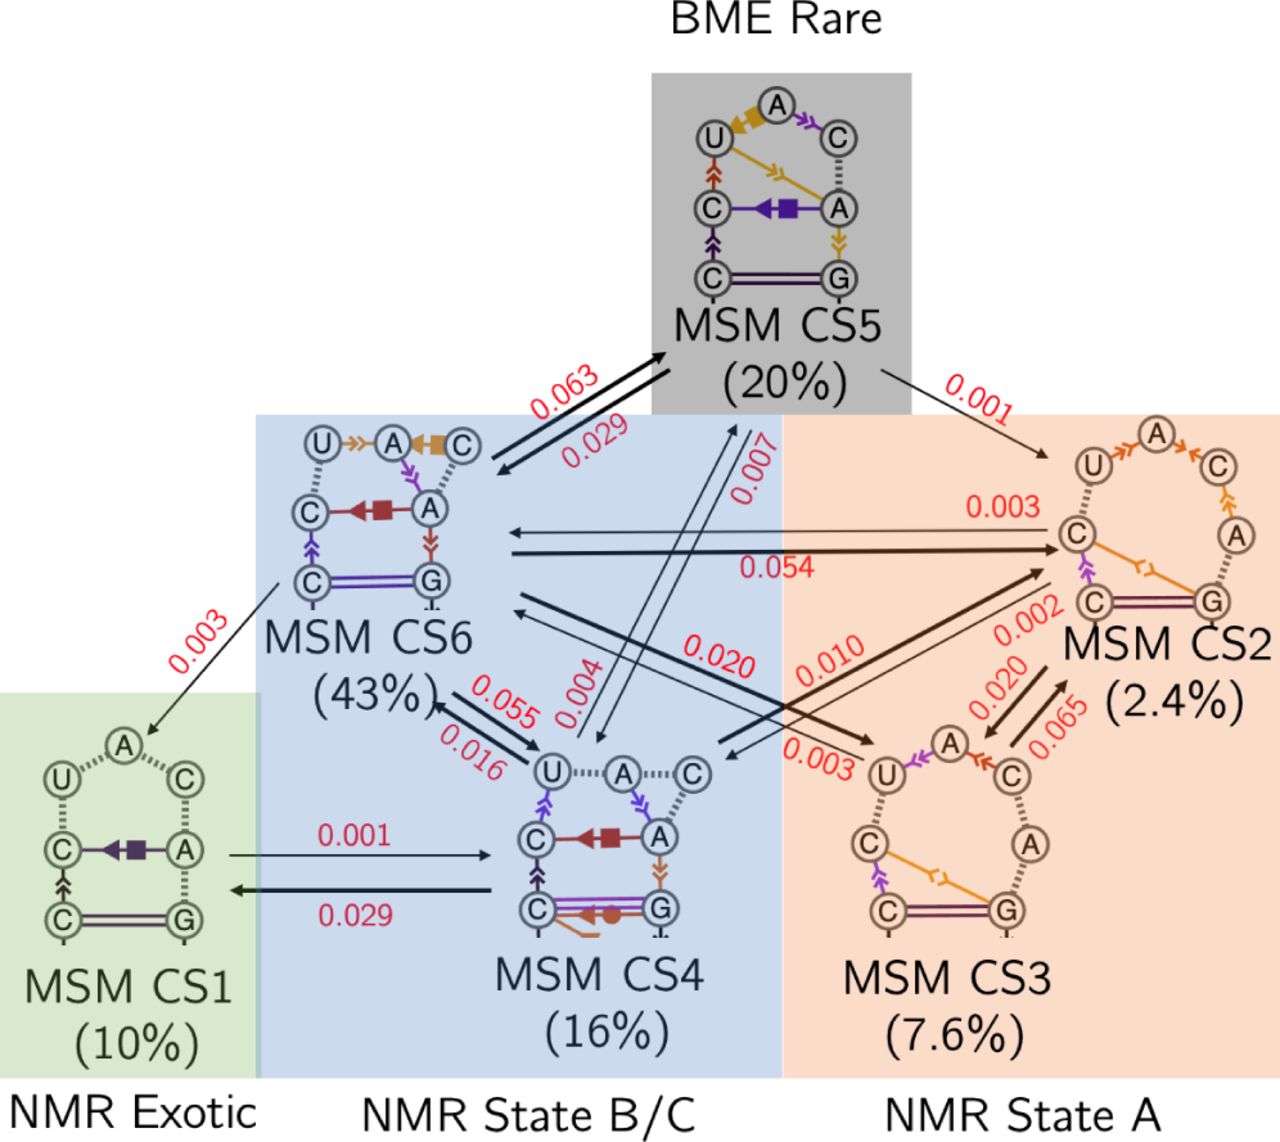
FIGURE 11.
Markov state model depicting transitions between six CSs derived from MD simulations, with each node represented by a dynamic secondary structure schematic incorporating both base-pairing and nucleobase stacking. Directed edges represent observed transitions, with arrow thickness and edge labels indicating the respective transition probabilities at a lag time of 30 nsec. Percentages below each MSM CS represent the proportion of frames from the MD-derived ensemble falling within the MSM macrostate. Self-transitions are not shown.




