


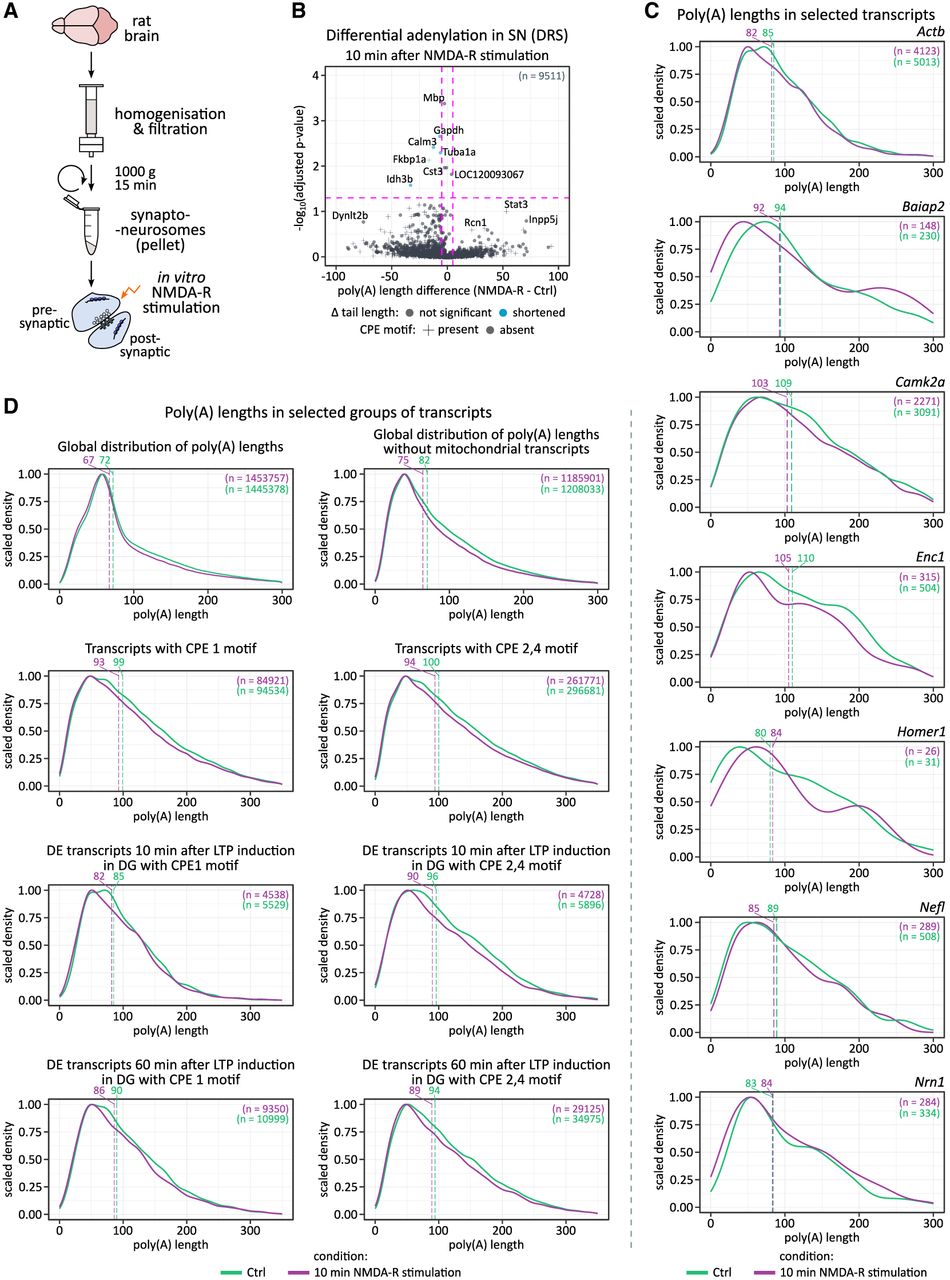
Poly(A) tail length distribution in synaptoneurosomes 10 min after in vitro NMDA-R stimulation (DRS). (A) Schematic depiction of synaptoneurosomes isolation and in vitro stimulation. (B) Polyadenylation profile of mRNAs in synaptoneurosomes upon NMDA-R stimulation. P-values between conditions were calculated using Wilcoxon signed-rank test, two-sided, α = 0.05, with Benjamini–Hochberg adjustment. The dashed lines divide the plot area into sectors based on P-value cut-off points and differences in poly(A) tail lengths. Zoomed view [cut-off −log10(adj. P-value) = 4] highlighting statistically significant gene alterations. Most mitochondrial genes were omitted for clarity (high adj. P-value, unchanged tail length). Unscaled version of this plot is provided in Supplemental Figure 8. (C) Poly(A) tail length distribution of selected transcripts involved in synaptic plasticity in synaptoneurosomes, measured by direct RNA sequencing (DRS). Dashed lines indicate median tail lengths for each condition, with median values shown above the plotting area. The total number of reads per condition (n) is also indicated. (D) Poly(A) tail length distribution of selected transcript groups in synaptoneurosomes, measured by direct RNA sequencing (DRS). Dashed lines indicate median tail lengths for each condition, with median values shown above the plotting area. The total number of reads per condition (n) is also indicated.




