


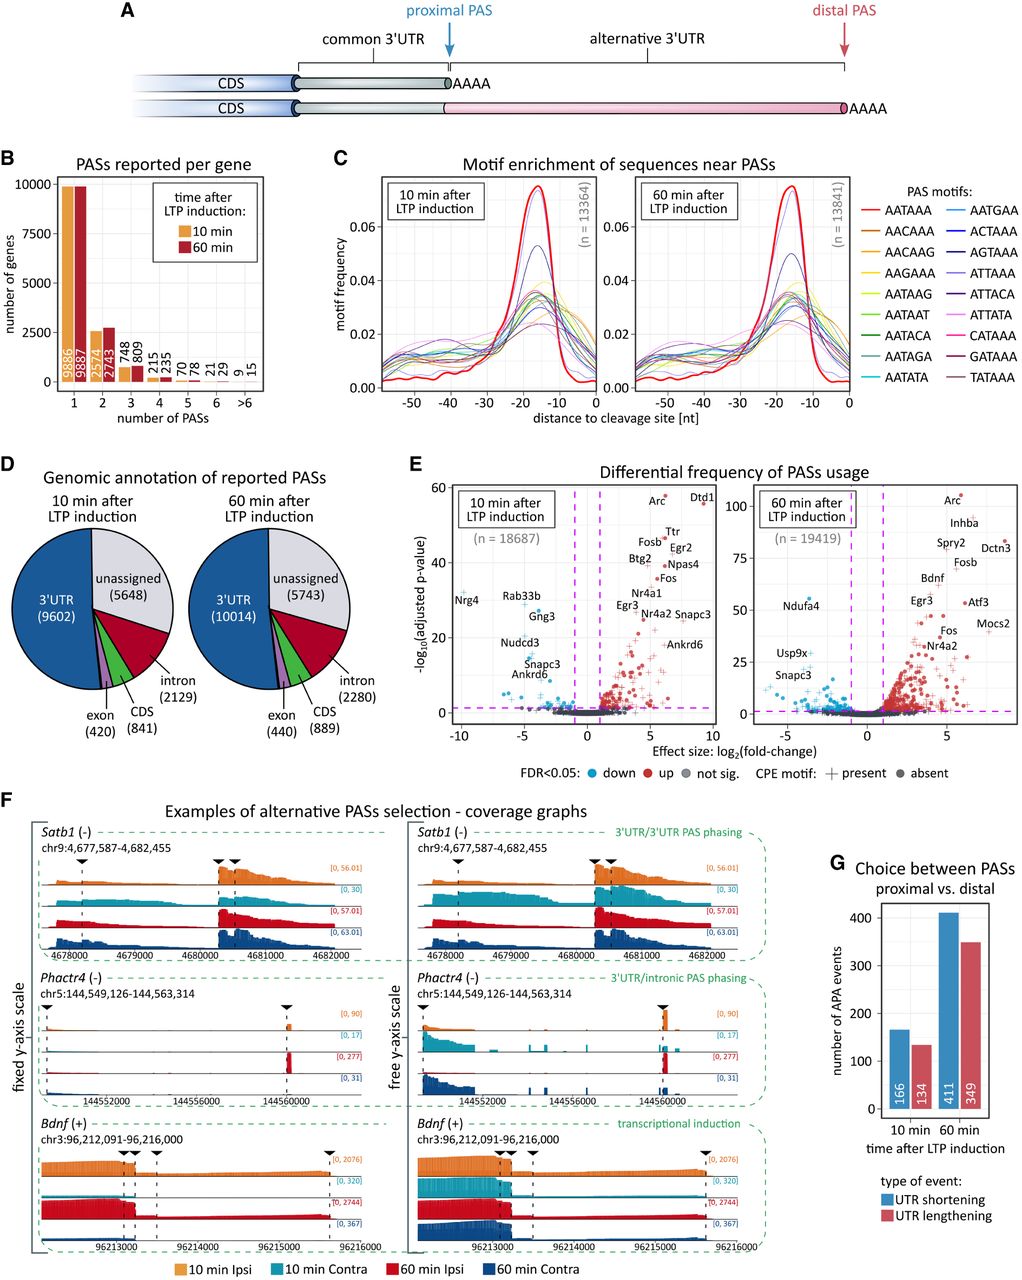
Differential polyadenylation site usage. (A) Schematic depiction of 3′UTR containing multiple PASs. (B) Number of PASs per gene reported by TAPAS. (C) Enriched motifs near detected PASs. (D) Genomic location assignment of reported PASs. (E) Relationship between PASs usage and expression level. Expression of PASs computed with TAPAS using a negative binomial generalized linear model with the Benjamini–Hochberg adjustment (α = 0.1). (F) Examples of genes exploiting multiple PASs with differential frequency due to various mechanisms (Satb1—alternative 3′UTRs [lengthening/shortening], Phactr4—intronic/3′UTR PASs selection, Bdnf—frequency modulated by transcriptional induction). A genome browser-like view of coverages in the 3′UTR region across conditions is shown. (G) Usage of distal and proximal PASs in genes with at least two PASs reported. A relative change in expression between conditions for proximal and distal PASs was computed in TAPAS using base-2 logarithms.




