


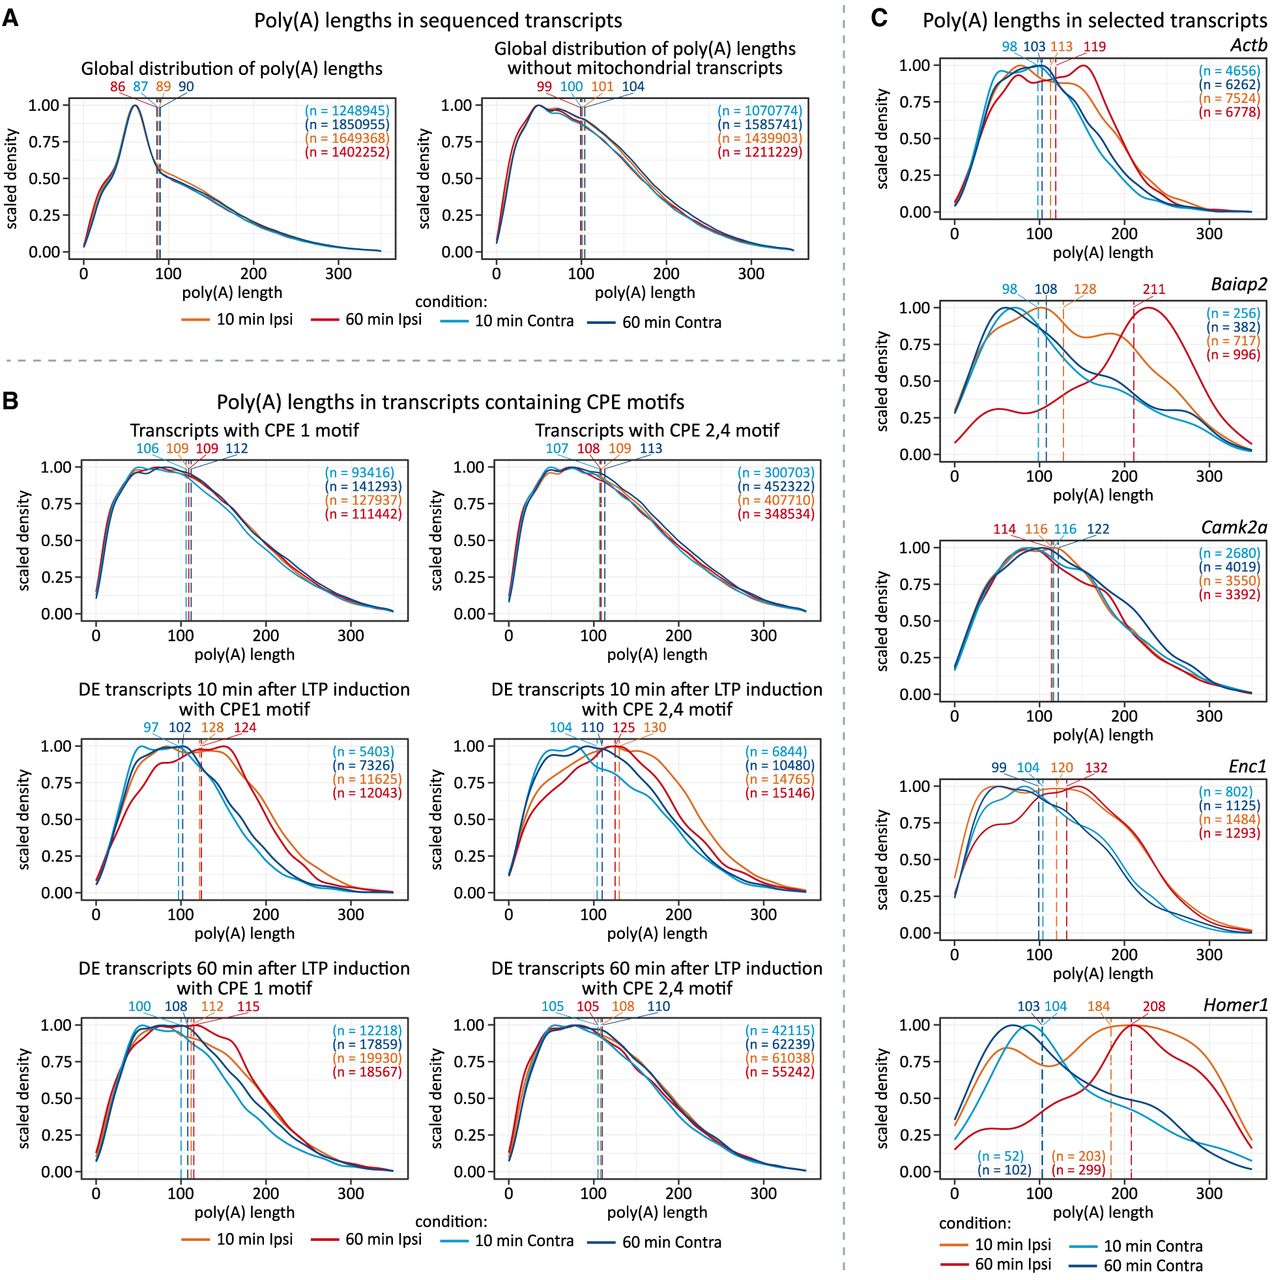
Distribution of poly(A) lengths in selected groups of mRNAs. (A) Global distribution of poly(A) lengths: upper panel—complete data sets, bottom panel—excluding mitochondrially encoded genes. (B) Distribution of poly(A) lengths in CPEB targets. (Upper left) Transcripts with CPE1 motif (total). (Upper right) Transcripts with CPE2,4 motifs (total). (Middle left) Transcripts with CPE1 motif differentially expressed 10 min after LTP induction. (Middle right) Transcripts with CPE1 motif differentially expressed 60 min after LTP induction. (Bottom left) Transcripts with CPE2,4 motifs differentially expressed 10 min after stimulation. (Bottom right) Transcripts with CPE2,4 motifs differentially expressed 60 min after LTP induction. All conditions are included in each panel. (C) Distribution of poly(A) lengths in selected transcripts associated with neuroplasticity. For A–C, dashed lines represent median tail lengths for each condition, with median values displayed above the plotting area. The total number of reads per condition (n) is also provided.




