


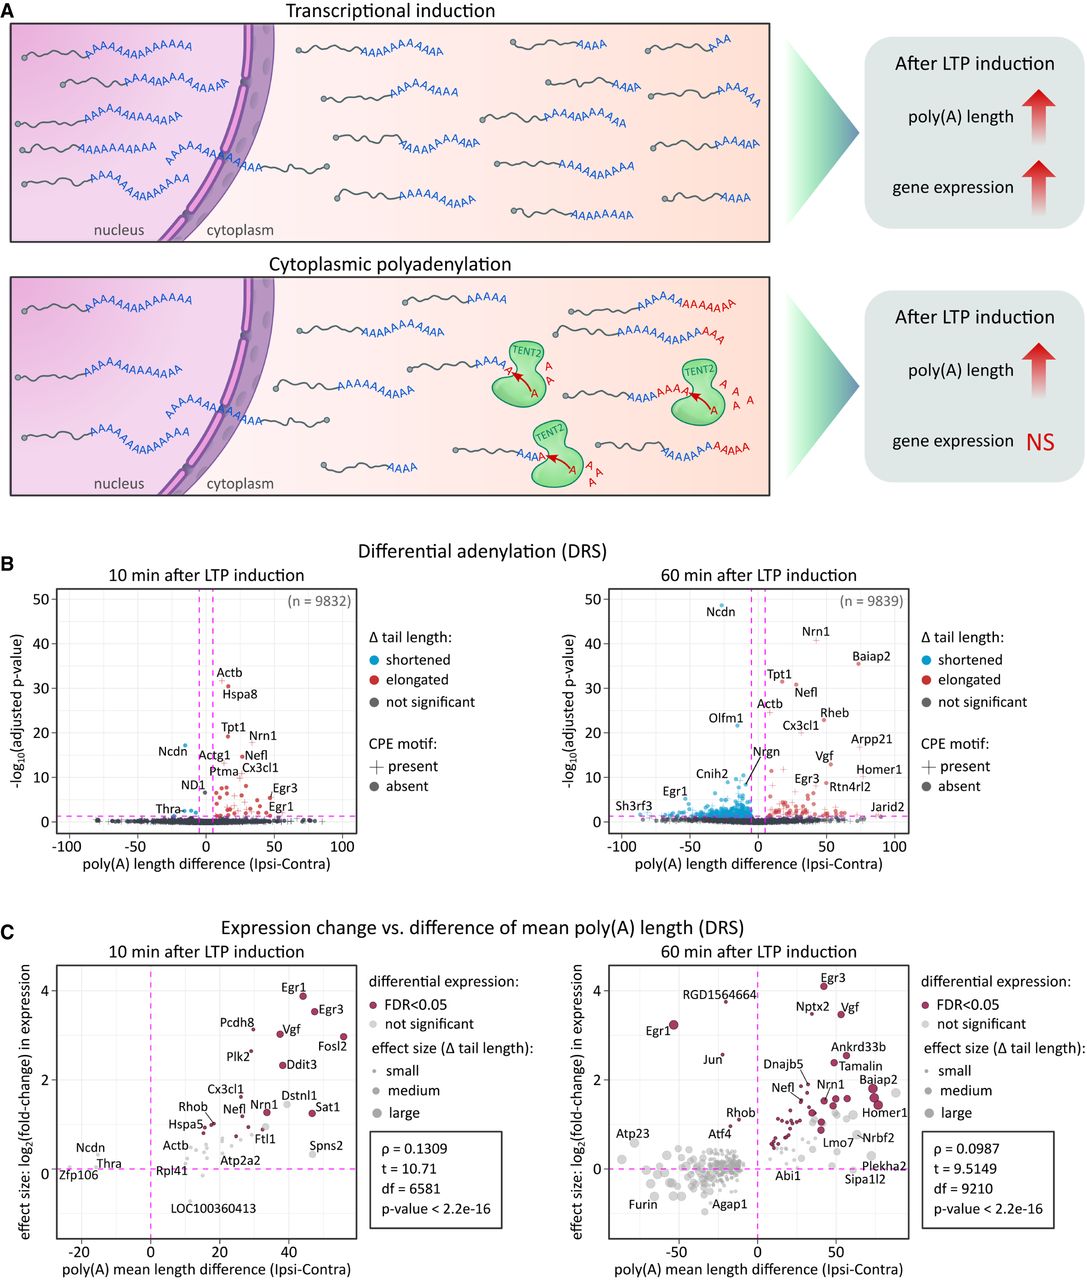
Dynamics of mRNA poly(A) tail lengths following LTP induction. (A) Schematic of two potential mechanisms: transcriptional induction and cytoplasmic polyadenylation, underlying observed poly(A) tail length changes. (B) Poly(A) tail length distributions at 10 and 60 min post-LTP. P-values between conditions were calculated using Wilcoxon signed-rank test, two-sided, α = 0.05, with Benjamini–Hochberg adjustment. The pink dashed lines divide the plot area into sectors based on P-value cut-off points and differences in poly(A) tail lengths. (C) Differential expression versus differential polyadenylation at 10 and 60 min post-LTP. Genes with significant changes in both are highlighted (maroon). Differential expression calculated using a negative binomial generalized linear model in DESeq2. Only transcripts with statistically significant poly(A) tail length changes are displayed for clarity. Pearson correlation (two-sided) coefficient, t-test, degrees of freedom, and P-value are provided.




