


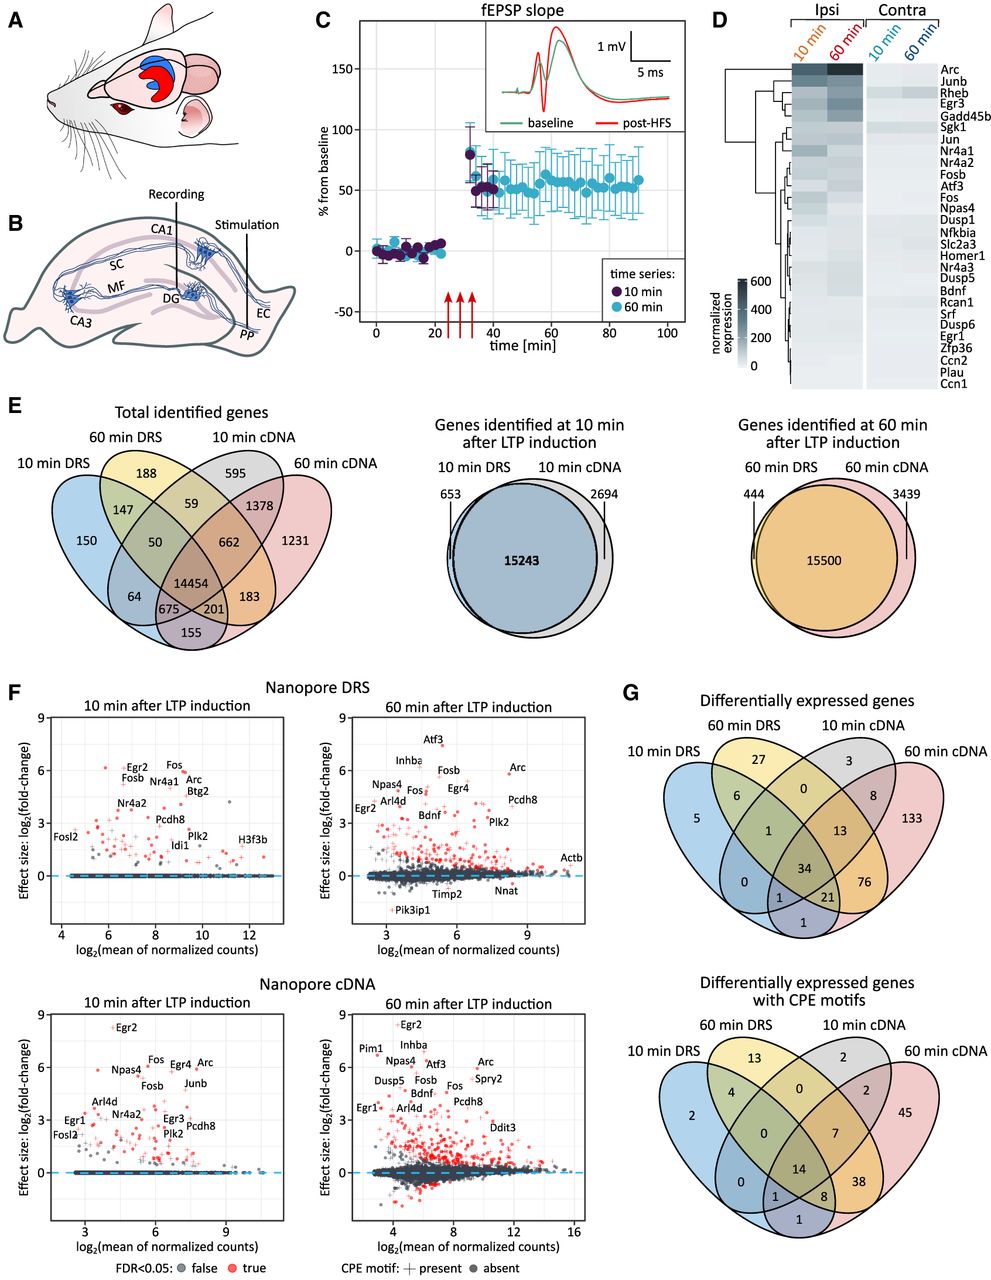
Dynamics of mRNA expression following in vivo hippocampal LTP induction. (A) Schematic view of rat hippocampus. LTP was induced in the dentate gyrus of the left hippocampus (ipsilateral, red), while the right hippocampus (contralateral, blue) served as control. (B) Schematic view showing placement of electrodes for in vivo stimulation of the medial perforant path fibers from the entorhinal cortex and recording of monosynaptically evoked fEPSPs in the dentate gyrus. (DG) – dentate gyrus, (MF) Mossy fibers, (SC) Schaffer collateral, (PP) perforant path, (EC) entorhinal cortex. (C) Representative HFS-induced LTP recordings in anesthetized rats. Time course of fEPSP slope changes (10 and 60 min post-HFS) relative to baseline (mean ± SEM). Red arrows indicate HFS sessions. Inset: Traces before (baseline, green) and after HFS (post-HFS, red). (D) Expression of IEGs in the dentate gyrus following LTP (Ipsi) versus control (Contra). Colors indicate normalized log2 expression levels. (E) Overlap of identified genes at 10 and 60 min post-LTP using DRS and cDNA. (Left) Venn diagram (all samples). (Middle and right) Overlap at 10 and 60 min. (F) DEGs in the dentate gyrus post-LTP. Log2 expression changes at 10 min (left) and 60 min (right) post-HFS. DEGs (red); genes with CPE motifs (+); genes without CPE motifs (dots). Results from DRS (top) and cDNA sequencing (bottom). Differential expression was calculated with DESeq2. Log2 fold-change estimates were shrunken (apeglm) for visualization clarity. (G) Overlap of DEGs at 10 and 60 min post-LTP using DRS and cDNA.




