


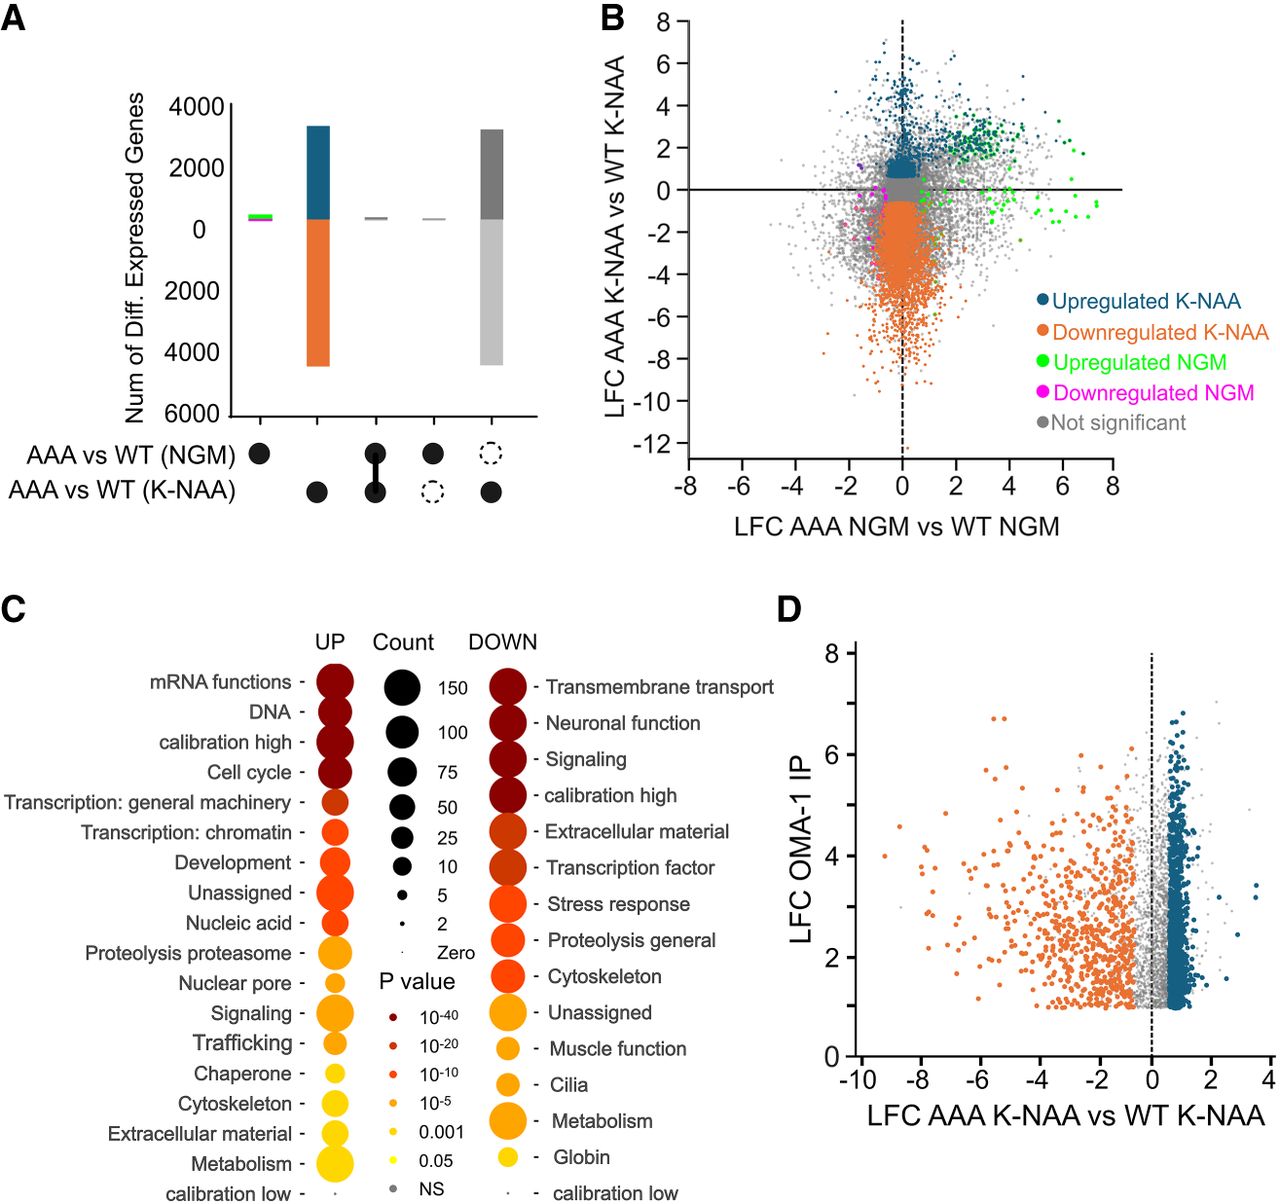
RNA-seq analysis comparing gene expression patterns in WT and AAA mutant embryos. (A) UpSet plots representing the number of genes upregulated (above the 0 line on the y-axis) or downregulated (below the 0 line). The labels under the graph indicate comparisons presented in the histogram between the indicated differentially expressed gene sets. A single closed circle indicates the number of differentially expressed genes in the indicated comparison. A vertical line between solid circles indicates the subset of genes found in both differentially expressed gene sets. A solid circle above or below a dashed circle indicates the subset of genes that are unique to the differentially expressed gene set with the solid circle and not found in the gene set with the dashed circle. The blue color indicates increased genes in the AAA mutant compared to WT controls upon K-NAA treatment. The orange color indicates decreased genes in the same comparison. Green indicates genes increased in the AAA mutant relative to WT under normal growth conditions, while purple represents downregulated genes in the same treatment. (B) Correlation plot showing that most gene expression changes are unique to the mutant upon K-NAA treatment. The coloring is as in A, except here gray represents nonsignificant changes. (C) WormCat analysis to identify gene categories upregulated or downregulated in the mutant compared to control in K-NAA treatment. The size of the circle indicates the number of genes in the set; the color indicates statistical significance. (D) Comparison of the LFC of mRNAs enriched in an OMA-1 IP (Tsukamoto et al. 2017) compared to the genes that change in the AAA mutant relative to control upon K-NAA treatment. The coloring is as in A.




