


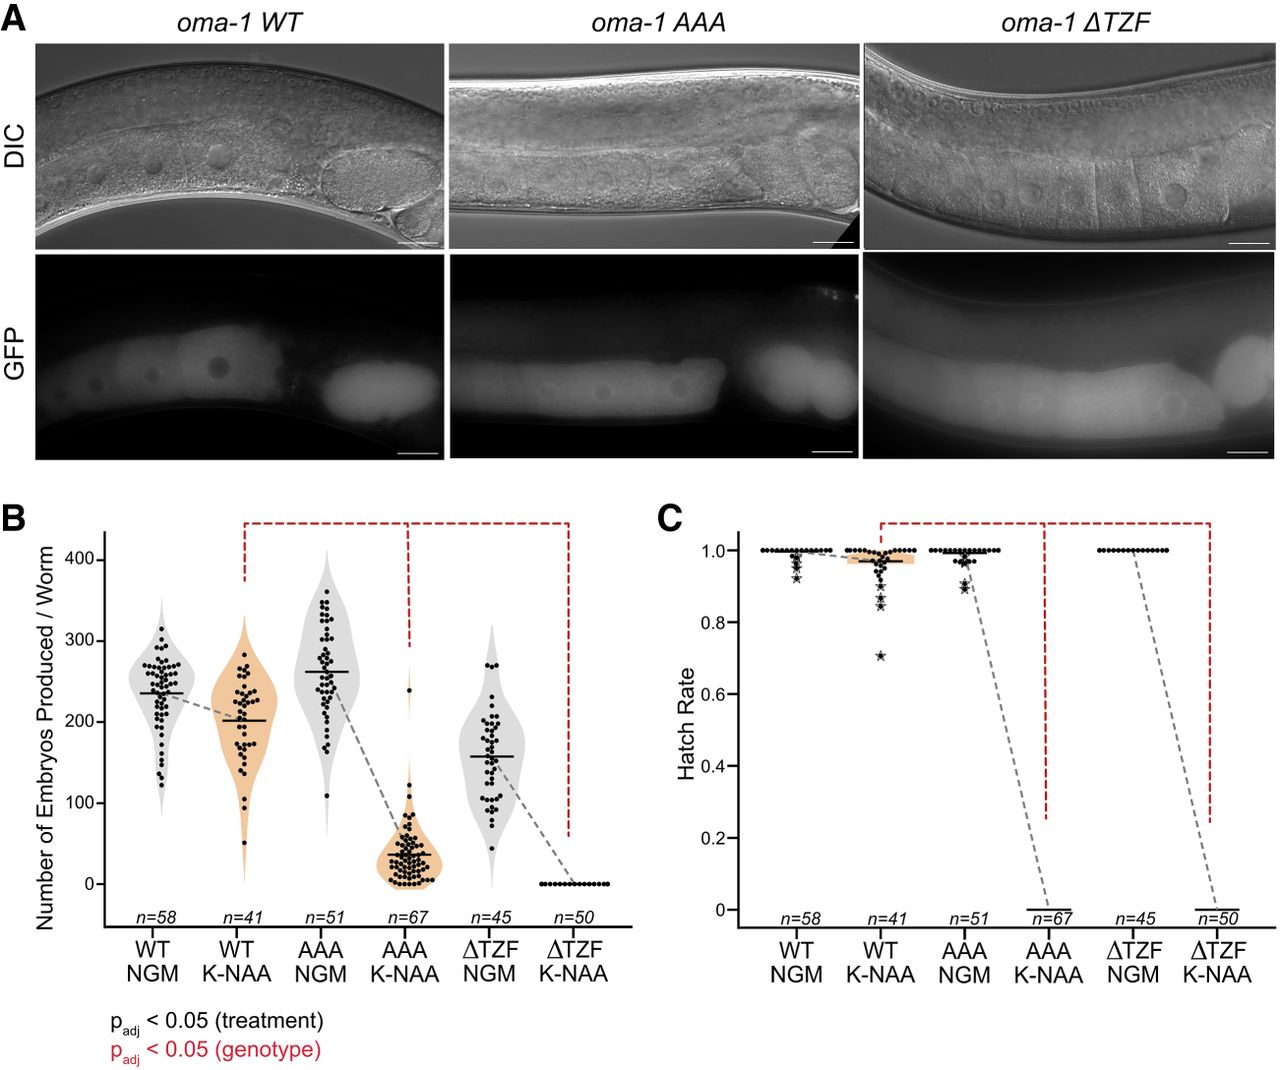
Brood size and hatch rate measurements for oma-1 variants. (A) Representative DIC and GFP images of OMA-1::GFP in live worms for the wild-type protein, the RRR to AAA mutant, and the TZF deletion mutant in the absence of K-NAA. The scale bar represents 20 µm. (B) Violin plots displaying the total number of embryos produced in all three variants in the absence (gray) and presence (orange) of K-NAA. The individual dots represent the brood of a single adult, and the vertical line represents the mean as in Figure 3. The statistical significance between conditions (black) and strains (red) is presented as in Figure 3. (C) Box and whisker plots displaying the hatch rate of embryos produced in all three strains as a function of K-NAA treatment. Dots represent the hatch rate of embryos produced by a single animal. Asterisks indicate outliers identified in Tukey analysis from a one-way ANOVA. Statistical significance is represented as in B.




