


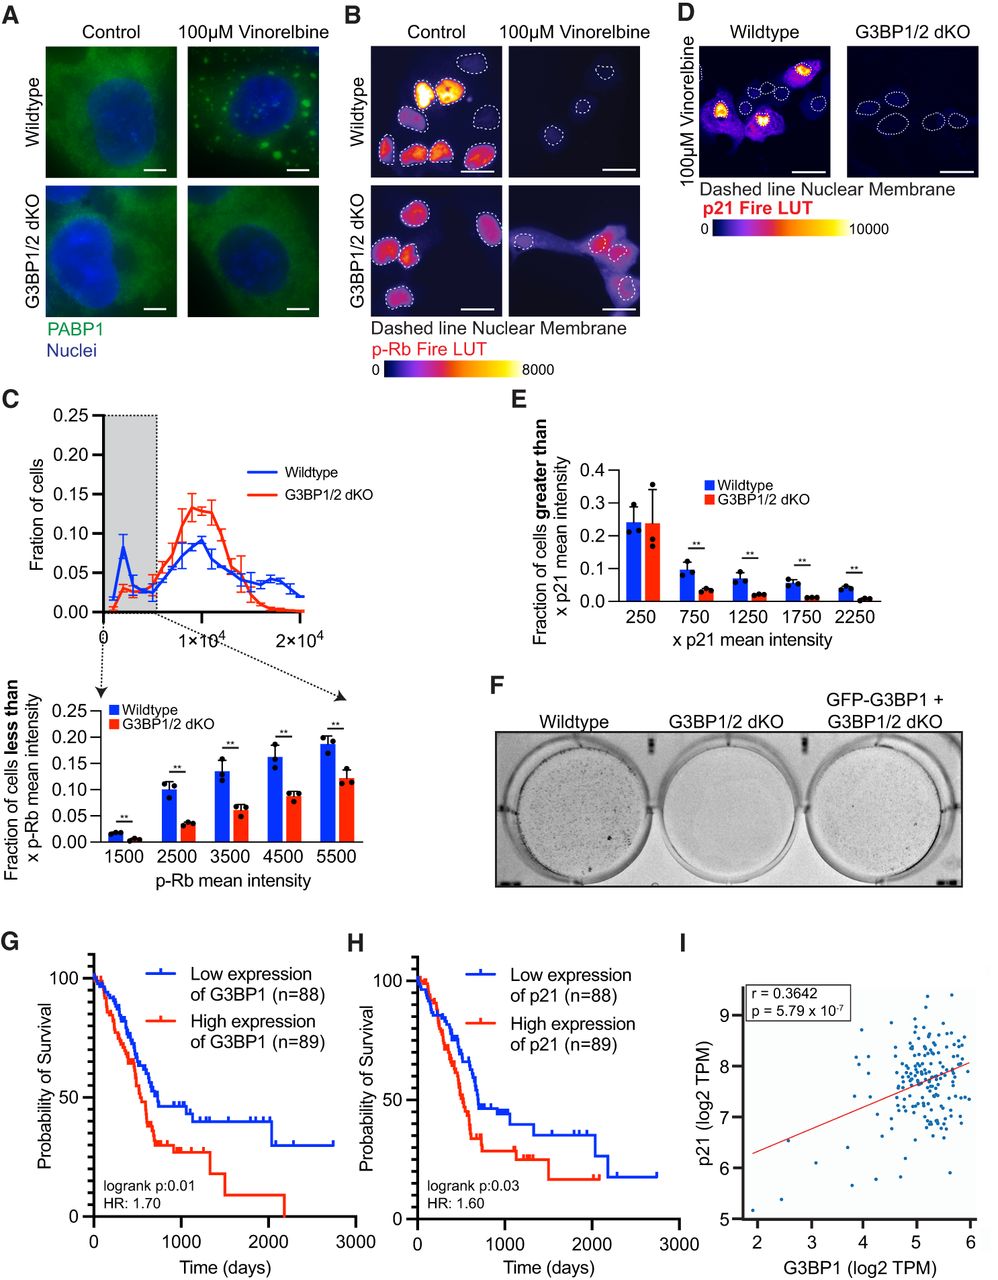
G3BP1/2 genes promote a greater fraction of cells with low p-Rb levels and greater levels of chemoresistance when treated with vinorelbine. (A) Representative PABP1 immunofluorescence images of wild-type and G3BP1/2 dKO U-2 OS cells treated with 100 µM vinorelbine or water (control) for 1 h. Scale bar, 5 µm. (B) Representative p-Rb immunofluorescence images of wild-type and G3BP1/2 dKO U-2 OS cells when treated with 100 µM vinorelbine or water (control) for 6 h. p-Rb immunofluorescence is color-coded using the Fire LUT, and the dashed lines indicate the nuclear membrane. Scale bar, 10 µm. (C, bottom) Bar graph illustrating the fraction of cells with mean p-Rb intensity in the nucleus below specified thresholds (1500, 2500, 3500, 4500, and 5500) for vinorelbine-treated wild-type and G3BP1/2 dKO from the experiment shown in B. The bar graph is derived from the frequency distribution blot above where the fraction of cells is binned by p-Rb mean intensity levels in vinorelbine-treated wild-type and G3BP1/2 dKO U-2 OS cells. Three independent biological replicates were performed. (D) Representative p21 immunofluorescence images of wild-type and G3BP1/2 dKO U-2 OS cells treated with 100 µM vinorelbine or water (control) for 6 h. The p21 immunofluorescence is color-coded using the Fire LUT, and dashed lines indicate the nuclear membrane. Scale bar, 25 µm. (E) Bar graph illustrating the fraction of cells with mean p21 intensity in the nucleus above specified thresholds (250, 750, 1250, and 2250) for vinorelbine-treated wild-type and G3BP1/2 dKO U-2 OS cells from the experiment shown in D. Three independent biological replicates were performed. (F) Representative image of the colony formation of wild-type, G3BP1/2 dKO, and GFP-G3BP1 + G3BP1/2 dKO U-2 OS cells stained with 0.5% crystal violet. Cells treated with 70 µM vinorelbine for 3 h, washed, and trypsinized, and 100,000 cells were seeded in a new plate. After 12 days of recovery, colony formation was assessed. The image is one representative biological replicate out of three. (G) Progression-free survival curves comparing high and low expression of G3BP1 in pancreatic adenocarcinoma patients sourced from OncoDB using The Cancer Genome Atlas (TCGA) data sets. (H) Progression-free survival curves comparing high and low expression of p21 in pancreatic adenocarcinoma patients from OncoDB using TCGA data sets. (I) Pair-wise gene expression correlation between G3BP1 and p21 genes in pancreatic adenocarcinoma tumors sourced from OncoDB using TCGA data sets. Graphs were retrieved from http://OncoDB.org.




