


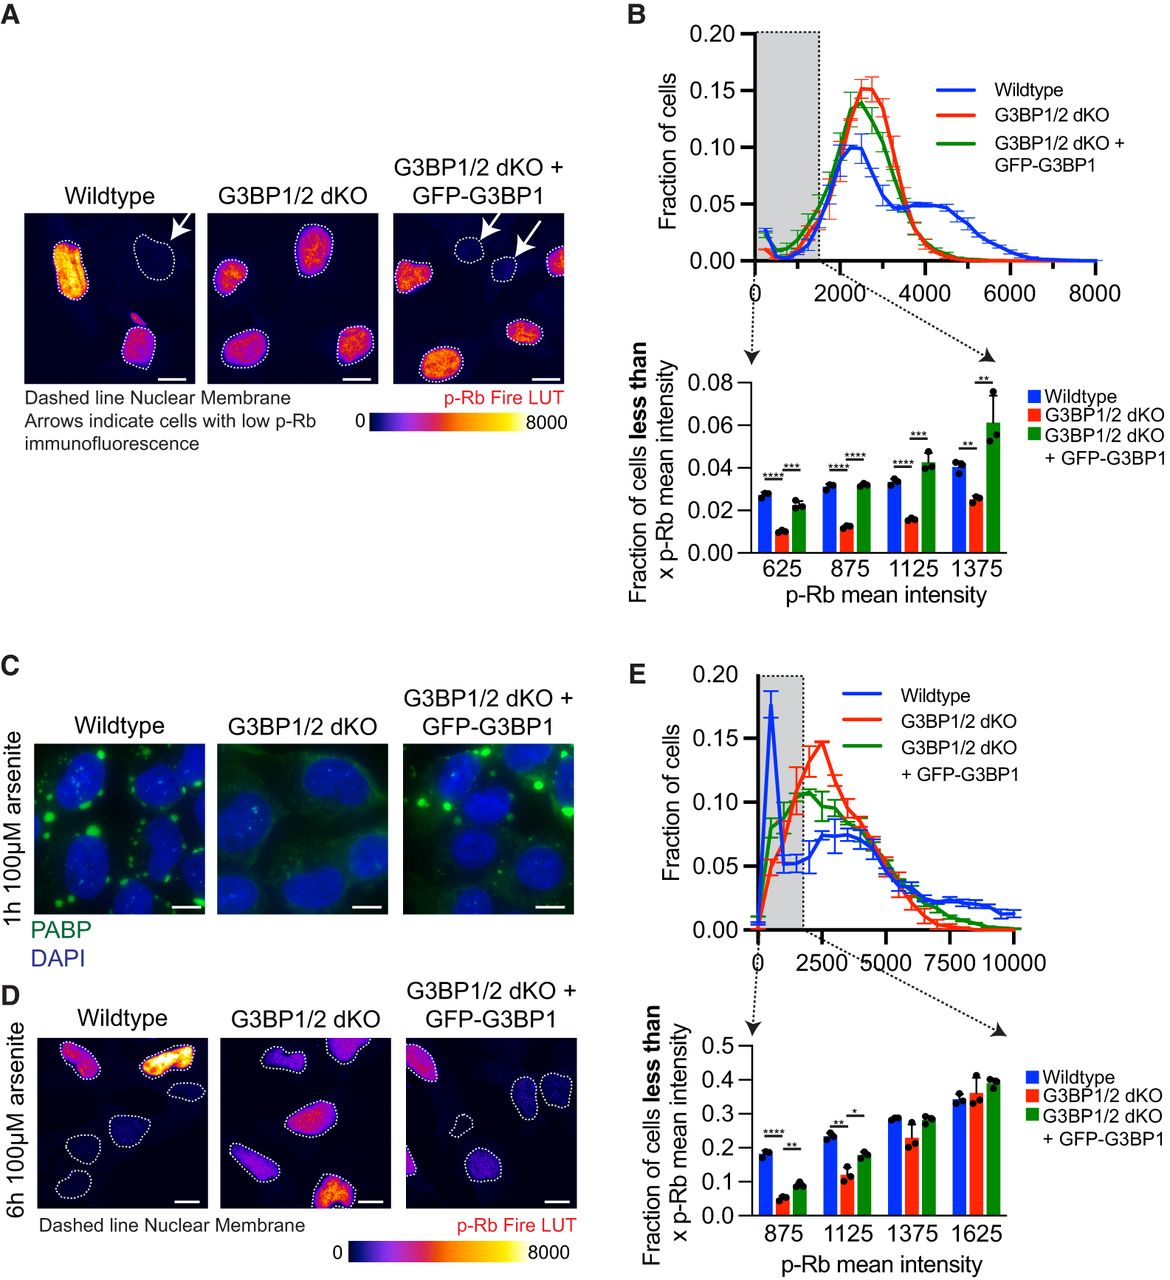
G3BP1/2 genes promote cell-cycle exit. (A) Representative p-Rb immunofluorescence images of wild-type, G3BP1/2 dKO, and GFP-G3BP1 + G3BP1/2 dKO U-2 OS cells. Arrows indicate cells with low p-Rb immunofluorescence, while dashed line denotes the nuclear membrane. The immunofluorescence is presented in Fire look-up table (LUT) to enhance the visualization of differences in p-Rb levels. Scale bar, 10 µm. (B, bottom) Bar graph depicting the fraction of cells with mean p-Rb intensity in the nucleus below specified thresholds (625, 875, 1125, or 1375) for wild-type, G3BP1/2 dKO, and GFP-G3BP1 + G3BP1/2 dKO U-2 OS cells. Results are derived from the frequency distribution plot above where the fraction of cells is binned by p-Rb mean intensity levels in untreated wild-type, G3BP1/2 dKO and GFP-G3BP1 + G3BP1/2 dKO U-2 OS cells. Three independent biological replicates were conducted. (C) Representative PABP1 immunofluorescence (green channel) and DAPI stain (blue channel) images of wild-type, G3BP1/2 dKO, and GFP-G3BP1 + G3BP1/2 dKO U-2 OS cells treated with 100 µM arsenite for 1 h. Scale bar, 5 µm. (D) Representative p-Rb immunofluorescence images of wild-type, G3BP1/2 dKO, and GFP-G3BP1 + G3BP1/2 dKO U-2 OS cells in untreated conditions or treated with 100 µM arsenite for 6 h. The dashed line represents the nuclear membrane. The immunofluorescence is shown in Fire LUT to enhance the distinction in p-Rb levels between cells. Scale bar, 10 µm. (E, bottom) Bar graph illustrating the fraction of cells with mean p-Rb intensity in the nucleus below specified thresholds (625, 875, 1125, or 1375) for wild-type, G3BP1/2 dKO, and GFP-G3BP1 + G3BP1/2 dKO U-2 OS cells. Results are derived from the frequency distribution blot above where the fraction of cells are binned based on p-Rb mean intensity levels in 6 h 100 µM arsenite-treated, G3BP1/2 dKO, and GFP-G3BP1 + G3BP1/2 dKO U-2 OS cells. Three independent biological replicates were performed. (*) P < 0.05, (****) P < 0.0001, (***) P < 0.001, (**) P < 0.01.




