


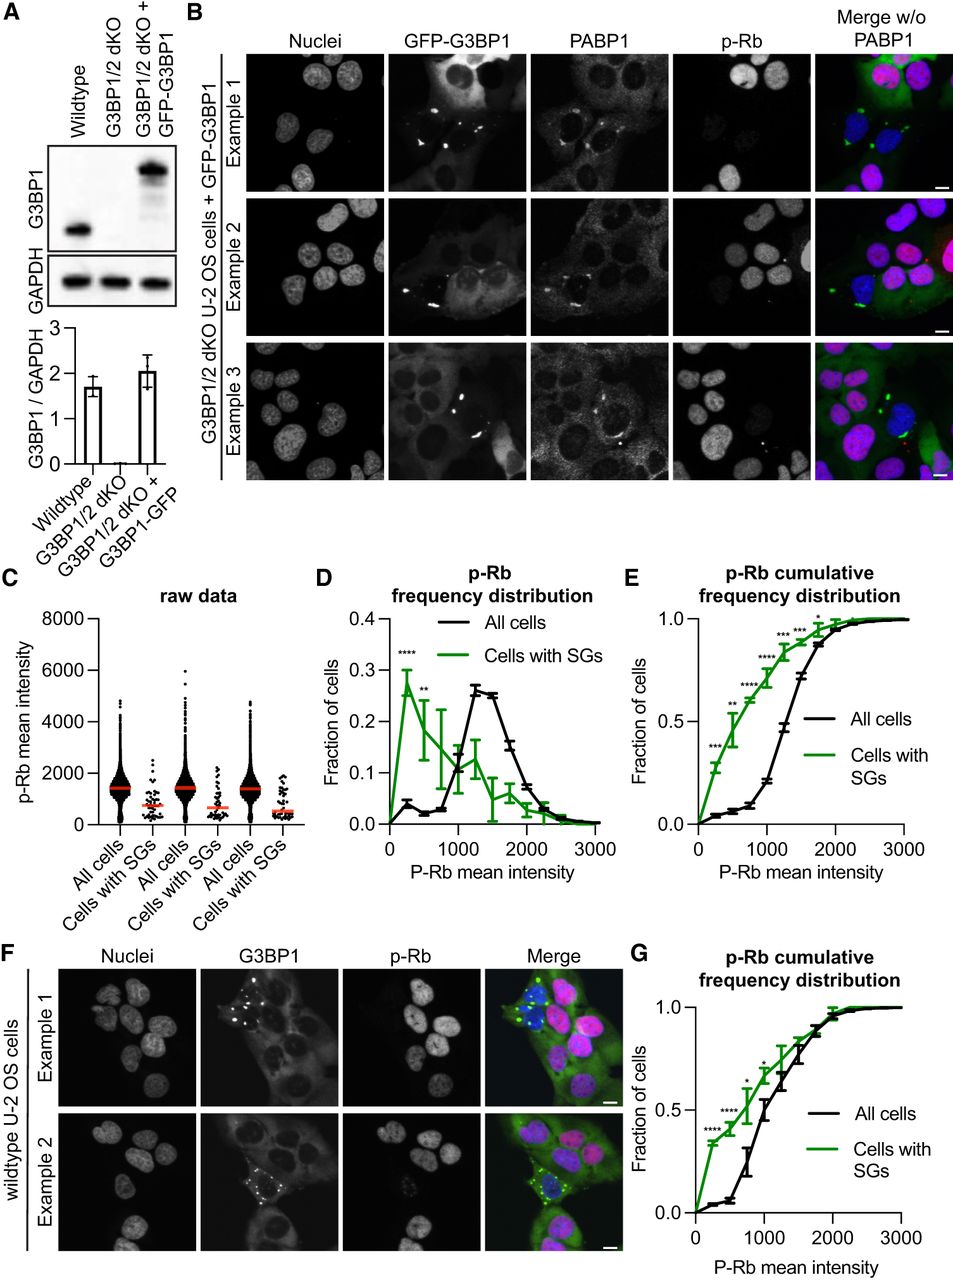
G3BP1/2 genes promote a greater fraction of cells with low phospho-Rb (p-Rb) levels under non-stress conditions. (A, top) Representative immunoblot depicting the expression of G3BP1 and GAPDH in wild-type, G3BP1/2 dKO U-2 OS and GFP-G3BP1 + G3BP1/2 dKO U-2 OS cell lines. (Below) Box plot of G3BP1/GAPDH immunoblot intensities from three biological replicates. (B) Representative images illustrating GFP-G3BP1 + G3BP1/2 dKO U-2 OS cells exhibiting spontaneous stress granules. 4',6-diamidino-2-phenylindole (DAPI) staining for nuclei, GFP fluorescence for GFP-G3BP1, PABP1 immunofluorescence, and p-Rb immunofluorescence are shown in grayscale individually. A merged image combines DAPI, GFP-G3BP1, and p-Rb channels in blue, green, and red, respectively, excluding PABP1. Scale bar, 20 µm. (C) Scatter plot illustrating the distribution of p-Rb levels in the nuclei of all cells and cells with observable stress granules for three independent biological replicates. Cells were considered to have stress granules when both GFP-G3BP1 and PABP1 were colocalized into puncta. The total number of cells and cells with stress granules for each replicate, respectively, are 10,552/54, 8237/48, and 9723/50. (D) Frequency distribution plot representing p-Rb intensity in the nuclei for all cells and cells with discernible stress granules in three biological replicates. (E) Cumulative frequency distribution plot illustrating p-Rb intensity in the nuclei for all cells and cells with visible stress granules in three biological replicates. (F) Representative images portraying wild-type U-2 OS cells with spontaneous stress granules. DAPI staining for nuclei, GFP fluorescence for GFP-G3BP1, and p-Rb immunofluorescence are shown in grayscale individually. Scale bar, 20 µm. (G) Cumulative frequency distribution plot illustrating p-Rb intensity in the nuclei for all cells and cells with evident stress granules for three biological replicates. Cells were considered to have stress granules if they contained G3BP1 puncta. The total number of cells and cells with stress granules for each replicate, respectively, are 4988/34, 4558/24, and 4667/27. (****) P < 0.0001, (***) P < 0.001, (**) P < 0.01, (*) P < 0.05.




