


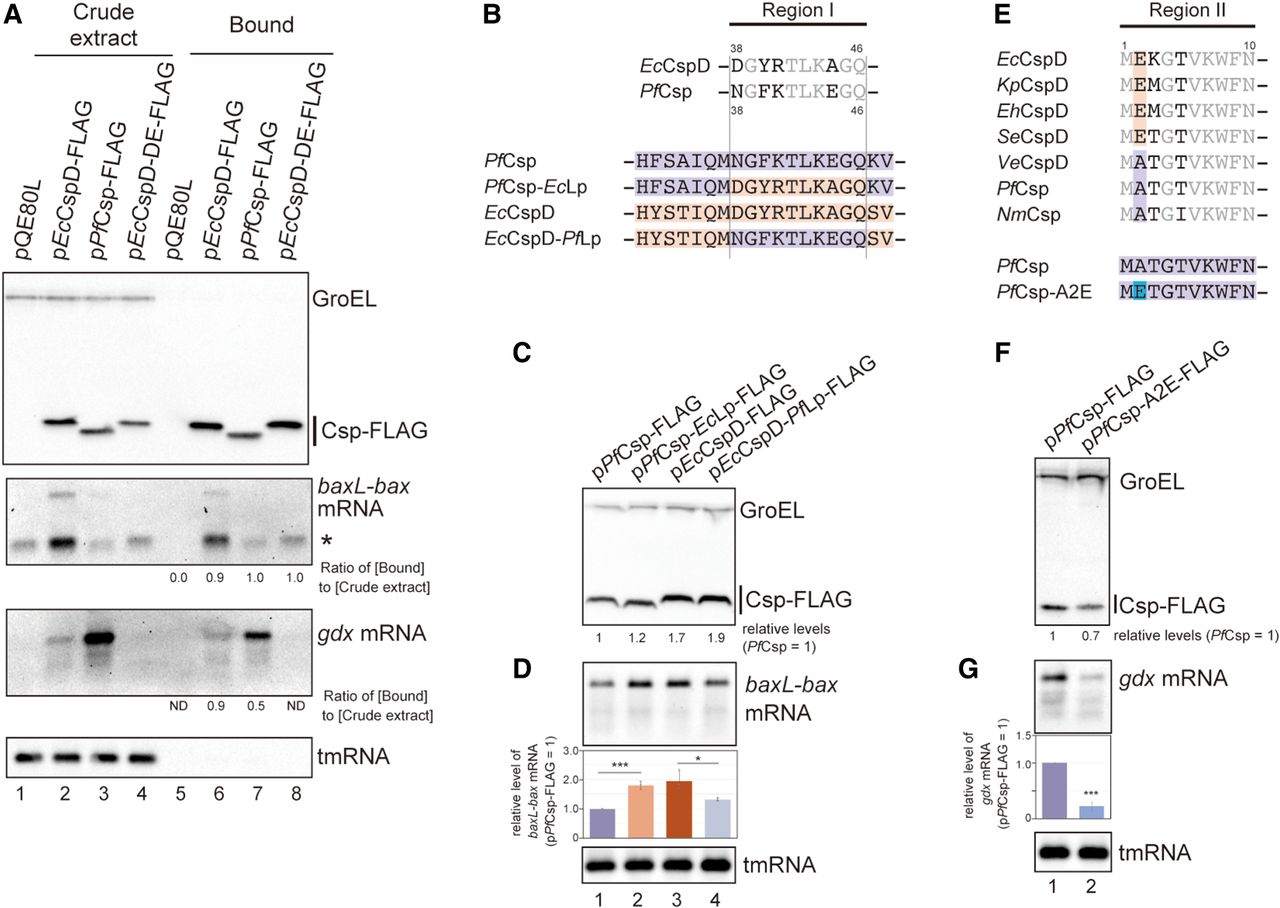
Target recognition by PfCsp. (A) In vivo binding of PfCsp-FLAG and EcCspD-DE-FLAG to baxL-bax mRNA and gdx mRNA. Crude extract was prepared from MG1655 cells harboring the indicated plasmids and subjected to the pull-down assay using anti-FLAG M2 magnetic beads as described in Materials and Methods. The ratio of (Bound) relative to (Crude extract) is shown at the bottom; in the calculation for baxL-bax mRNA, the sum of the full-length and truncated (*) was used. Data shown are representative of the two independent experiments. (B) Sequence alignment of Region I. Conserved residues between PfCsp and EcCspD are shown in gray. The regions originating from PfCsp and EcCspD are marked in purple and orange, respectively, and mutation sites are indicated in the colors of the originating Csp. (C,D) Expression and properties of mutants. MG1655 cells harboring the indicated plasmids were grown in LB-ampicillin medium. At an OD600 of 0.3, 0.2 mM IPTG was added to cultures to induce Csps. Incubation was continued for 30 min. (C) The protein sample was subjected to western blotting using anti-FLAG monoclonal antibody and anti-GroEL polyclonal antibodies. (D) The RNA sample was subjected to northern blotting using probes for baxL-bax mRNA or tmRNA. Quantitation data is shown below the northern blot; averages of relative RNA levels were calculated from three independent experiments, with error bars representing the standard deviations. The RNA sample of PfCsp was set to 1. (E) Sequence alignment of the N-terminal portion. Conserved residues between the K-A and K-E proteins are shown in gray. E and A at the second position are marked in orange and purple, respectively. (F,G) Effect of point mutation in the position 2 of PfCsp on gdx induction. MG1655 cells harboring the indicated plasmids were analyzed as in C. Relative RNA levels were calculated, with the RNA sample of PfCsp set to 1. Statistical significance was calculated using an unpaired two-tailed Student's t-test. (*) P < 0.05, (***) P < 0.001.




