


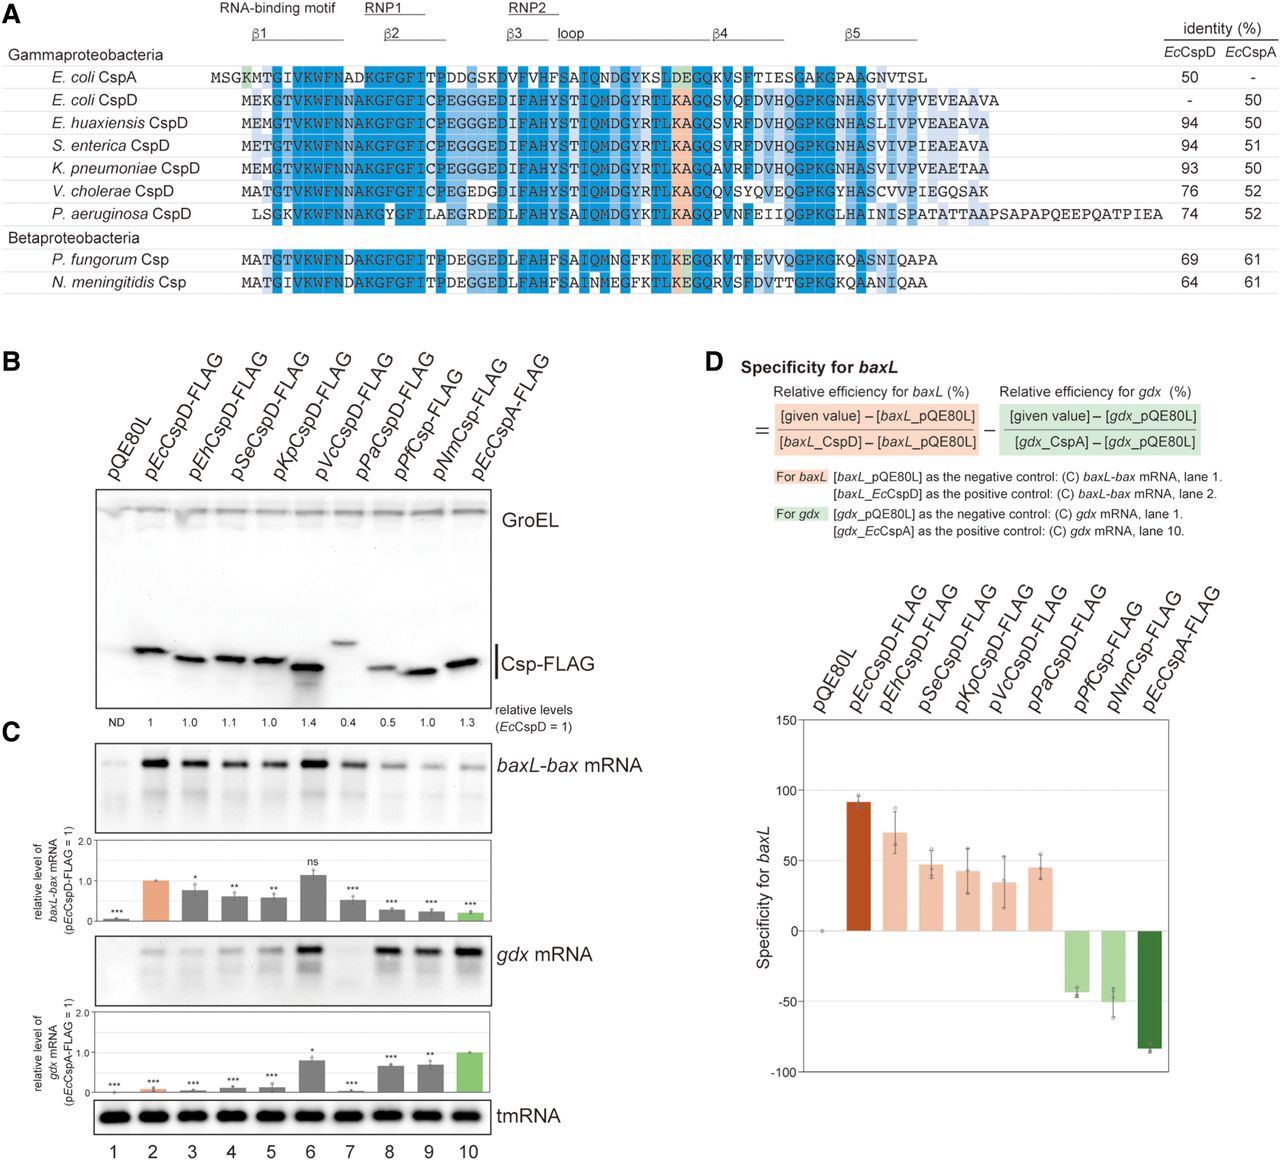
Csps grouped by identified amino acid residues. (A) Sequence alignment of the Csps tested. K4, D46, and E47 in EcCspA and the identical residues at the same position are highlighted in green, whereas K43 and A44 in EcCspD and the identical residues at the same position are highlighted in orange. Amino acid residues with more than 80% identity across all of the shown Csps are marked in dark blue; those with identities of 60%–80% and 40%–60% are marked in blue and light blue, respectively. Percent identities of Csps with EcCspD and EcCspA based on comparison by the NCBI BLAST are indicated to the right. (B,C) Expression and properties of the grouped Csps. MG1655 cells harboring the indicated plasmids were grown in LB-ampicillin medium. At an OD600 of 0.3, 0.2 mM IPTG was added to cultures to induce Csps. Incubation was continued for 30 min. (B) The protein sample was subjected to western blotting using anti-FLAG monoclonal antibody and anti-GroEL polyclonal antibodies. (C) The RNA sample was subjected to northern blotting using probes for baxL-bax mRNA, gdx mRNA, or tmRNA. Quantitation data are shown below the northern blot; averages of relative RNA levels were calculated from three independent experiments, with error bars representing the standard deviations. The RNA samples of EcCspD and EcCspA were set to 1 for baxL-bax mRNA and gdx mRNA, respectively. Statistical significance was calculated using an unpaired two-tailed Student's t-test. (ns) Not significant, (*) P < 0.05, (**) P < 0.01, (***) P < 0.001. (D) Evaluation of target specificity. The specificity score was calculated by a formula in which the level of gdx mRNA relative to that seen for CspA (relative efficiency for gdx) was subtracted from the level of baxL mRNA relative to that seen for CspD (relative efficiency for baxL). The quantitative data in C was used to calculate each efficiency. The results are averages of three independent experiments, with error bars representing the standard deviations.




