


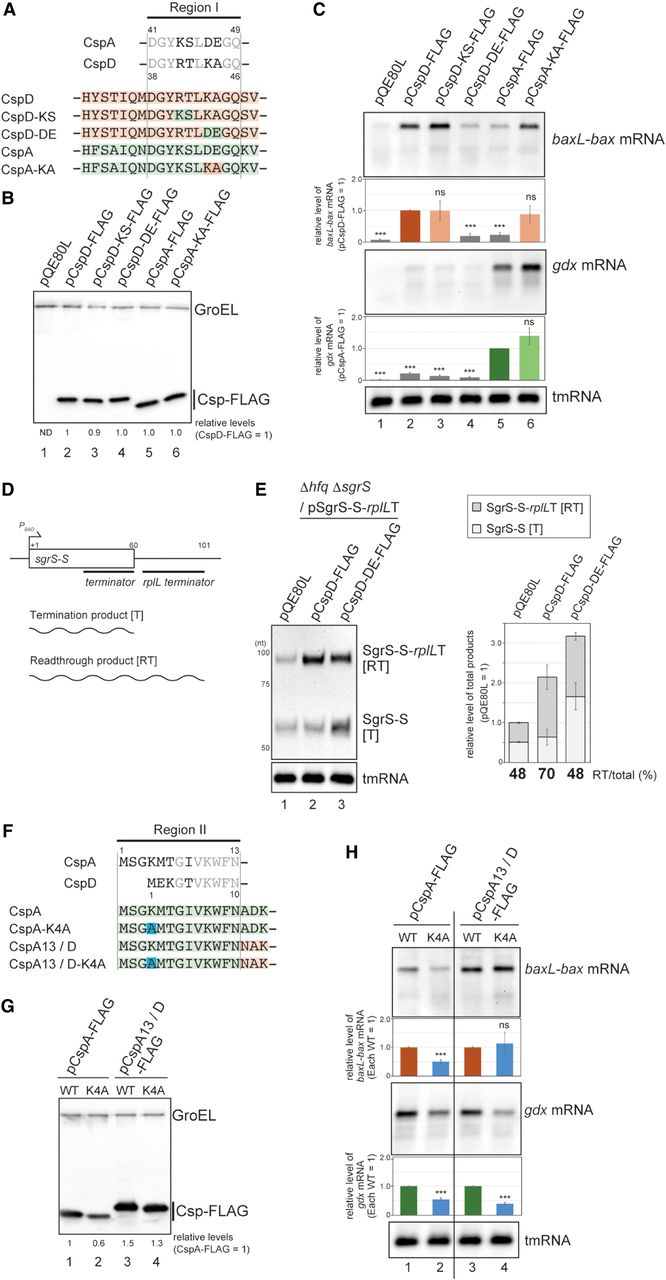
Dissection of Region I and Region II. (A) Sequence alignment of Region I. Conserved residues between CspA and CspD are shown in gray. The regions originating from CspA and CspD are marked in green and orange, respectively, and mutation sites are indicated in the colors of the originating Csp. (B,C) Effect of mutations in Region I. MG1655 cells harboring the indicated plasmids were grown in LB-ampicillin medium. At an OD600 of 0.3, 0.2 mM IPTG was added to cultures to induce Csps. Incubation was continued for 30 min. (B) The protein sample was subjected to western blotting using anti-FLAG monoclonal antibody and anti-GroEL polyclonal antibodies. (C) The RNA sample was subjected to northern blotting using probes for baxL-bax mRNA, gdx mRNA, or tmRNA. Quantitation data are shown below the northern blot; averages of relative RNA levels were calculated from three independent experiments, with error bars representing the standard deviations. The RNA samples of CspD and CspA were set to 1 for baxL-bax mRNA and gdx mRNA, respectively. (D,E) A double terminator system for SgrS (Morita et al. 2015), and effect of a mutant CspD. TM772 (Δhfq ΔsgrR-sgrS) cells harboring the indicated plasmids were grown in LB kanamycin, ampicillin medium. At an OD600 of 0.2, 0.2 mM IPTG was added to cultures to induce Csps, and incubation was continued for 60 min. Then, 0.4% arabinose was added to cultures to induce sgrS-S-rplLT, and incubation was continued for 10 min. The RNA sample was subjected to northern blotting using probes for SgrS-S or tmRNA. Quantitation of the northern blot data is shown to the right. Upper dark gray bars indicate the readthrough transcript (RT); lower light gray bars indicate the terminated product (T), the total bar indicates the sum of T and RT. Relative RNA levels are calculated, with the RNA sample of the vector control set to 1. Percentage of the RT relative to total is shown at the bottom. (F) Sequence alignment of Region II. Conserved residues between CspA and CspD are shown in gray. The regions originating from CspA and CspD are marked in green and orange, respectively, and mutation sites are indicated in blue. (G,H) Effect of mutations in Region II. MG1655 cells harboring the indicated plasmids were analyzed as in B. Quantitation data are shown below the northern blot; averages of relative RNA levels were calculated from three independent experiments, with error bars representing the standard deviations. The RNA samples of each parental plasmid were set to 1. Statistical significance was calculated using an unpaired two-tailed Student's t-test. (ns) Not significant, (***) P < 0.001.




