


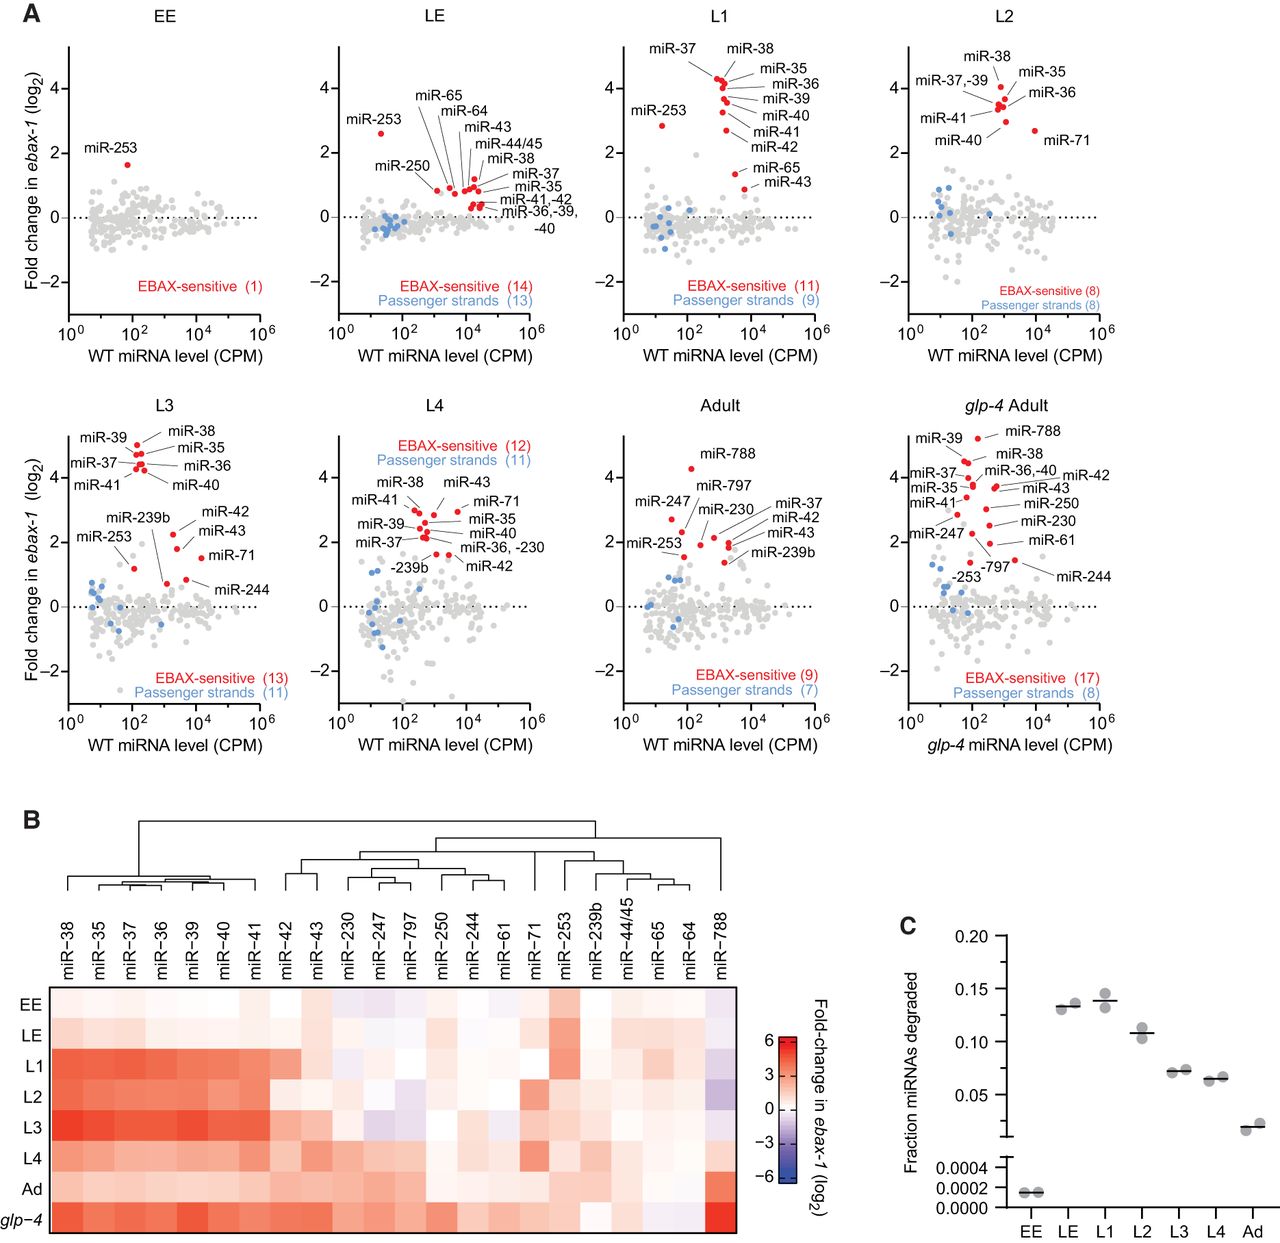
EBAX-1 limits accumulation of 22 miRNAs across worm development. (A) The effect of EBAX-1 loss on miRNA levels in worms of the indicated stage, as measured by sRNA-seq. Plotted are fold-changes in miRNA levels in ebax-1(tm2321) null-mutant worms compared to wild-type worms. Points for miRNAs called EBAX-1–sensitive are red, and those of their corresponding passenger strands are blue. miRNAs were called EBAX-sensitive by a statistical pipeline combining DESeq2 and a bi-beta uniform mixture (BBUM) model of noise and secondary effects with a false discovery rate (FDR) threshold of < 0.01 (Supplemental Table S1). miRNA levels are expressed as counts per million miRNA reads (CPM; including one pseudocount), averaged across two biological replicates. miRNAs were filtered for a mean wild-type expression of ≥5 CPM (including the pseudocount) for reliable quantification. Some miRNAs did not have passenger strands that exceeded this expression cutoff, whereas miR-44/45 had two quantifiable passenger strands at each stage examined (Supplemental Table S1). Results from adult worms were reanalyzed from Shi et al. (2020). For consistency, we reanalyzed only the two adult replicates whose ebax-1 mutant samples were derived from strain CZ9907, as samples of all other stages were obtained using this strain. Our lower limit for the y-axes excluded three points: miR-1817 in L4, miR-77 in L2, and lin-4 in EE. (B) Summary of EBAX-1–sensitive miRNAs identified through sRNA-seq. Shown are mean fold changes in miRNA levels upon EBAX-1 loss at each stage examined for miRNAs that were EBAX-1–sensitive at one or more stages. To group miRNAs with similar patterns of EBAX-1 sensitivity across development, we performed unsupervised hierarchical clustering on the fold-change data using the R package ComplexHeatmap with default clustering parameters. (C) The fraction of cellular miRNA molecules degraded through EBAX-1 across development. For each sRNA-seq library at each developmental stage, raw miRNA counts corresponding to EBAX-1–sensitive or non-EBAX-1–sensitive miRNAs were summed. Wild-type miRNA counts were then scaled so that the sum of their non-EBAX-1–sensitive miRNA counts equaled that in the ebax-1 mutant in the same replicate, allowing absolute comparisons of EBAX-1–sensitive miRNA counts. The wild-type sum of EBAX-1–sensitive miRNA counts after scaling was then subtracted from the sum of unscaled EBAX-1–sensitive miRNA counts, yielding an estimate of how many EBAX-1–sensitive molecules accumulated in the ebax-1 mutant. The resulting difference was divided by the unscaled sum of all miRNA counts in the ebax-1 mutant library to yield the fraction of cellular miRNA molecules degraded. Each point denotes a biological replicate, and lines denote the mean of the two replicates.




