


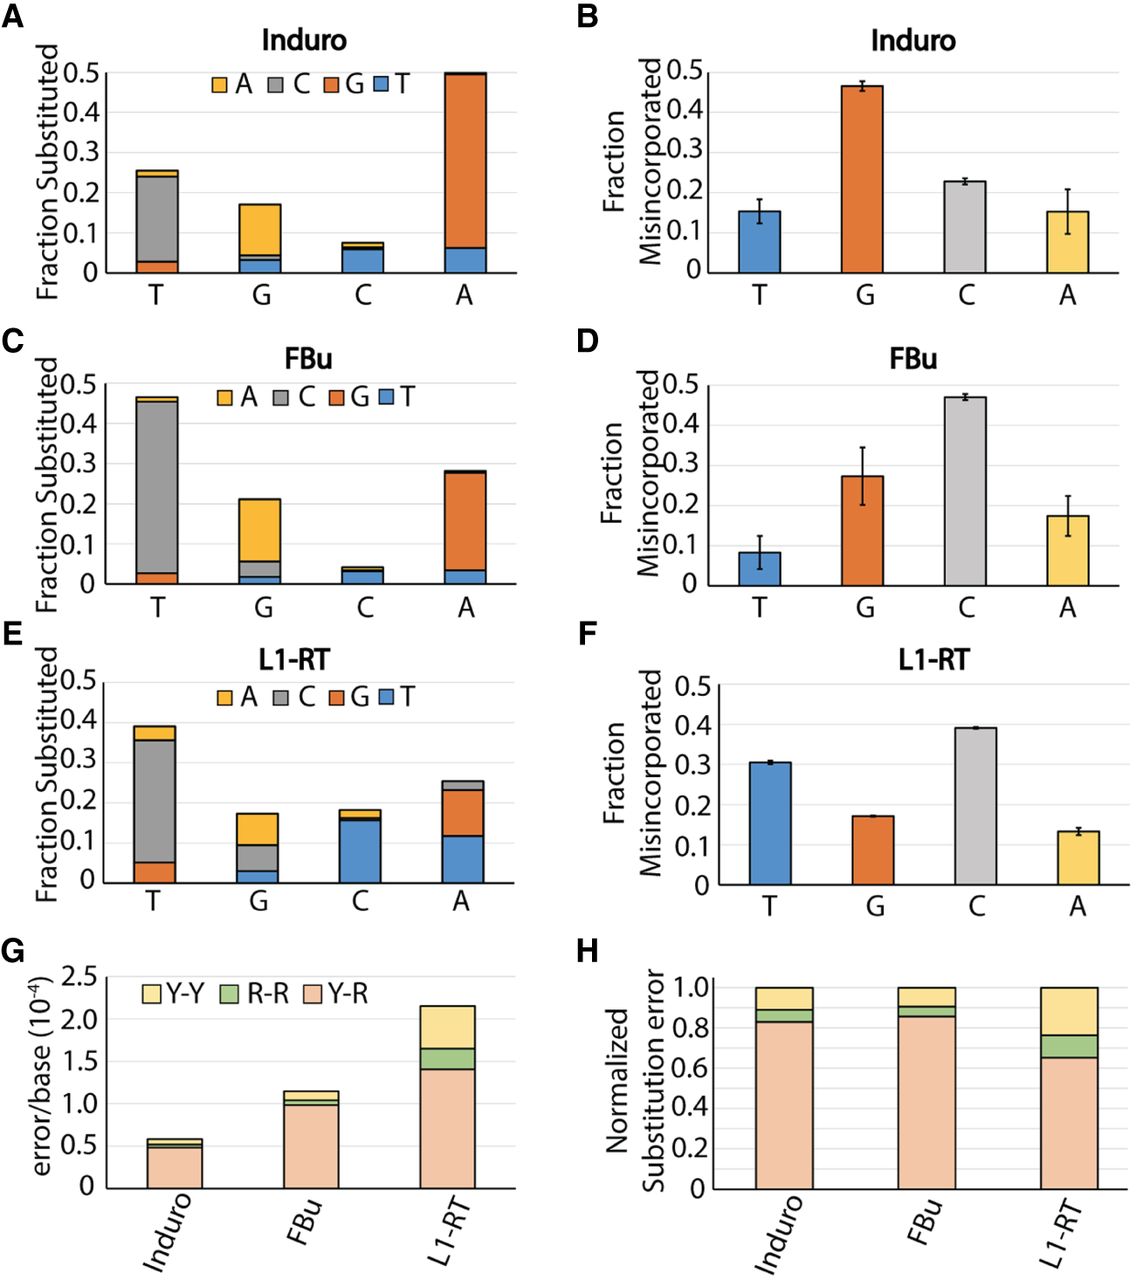
Breakdown of substitution mutations for reverse transcriptases. (A) Fraction of substitution error generated for each nucleotide by Induro. Fractions are subdivided by the proportion of misincorporation for adenine (yellow), cytosine (gray), guanine (orange), and thymine (blue). (B) Fraction of misincorporation for each nucleotide by Induro. (C) Fraction of substitution error generated at each cognate nucleotide by FBu. Fractions are subdivided by the proportion of misincorporation for adenine (yellow), cytosine (gray), guanine (orange), and thymine (blue). (D) Fraction of misincorporation for each nucleotide by FBu. (E) Fraction of substitution error generated at each cognate nucleotide by L1-RT. Fractions are subdivided by the proportion of misincorporation for adenine (yellow), cytosine (gray), guanine (orange), and thymine (blue). (F) Fraction of misincorporation for each nucleotide by L1-RT. (G) Substitution error rates of RTs subdivided by mutation type. (H) Normalized substitution errors by type.




